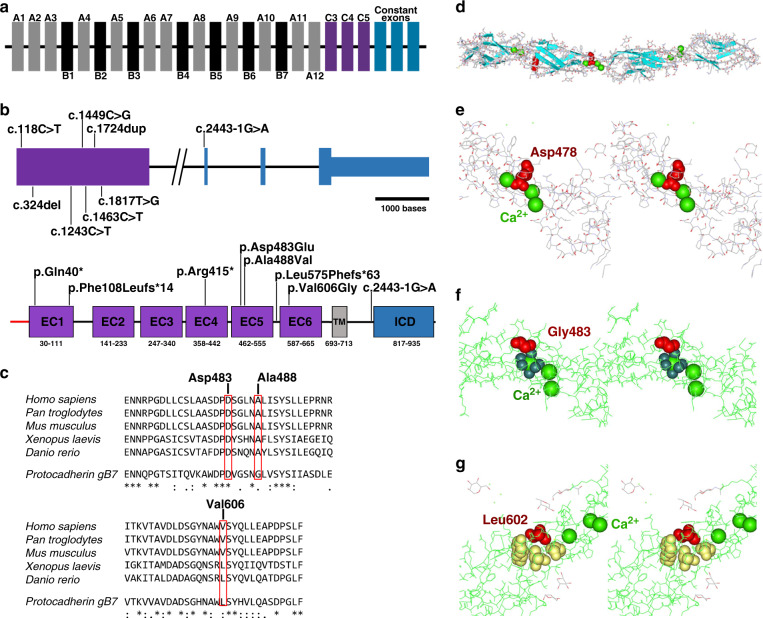
Fig. 3. Molecular characterization and in silico analysis of identified disease-causing variants in PCDHGC4.
(a) Schematic representation of the human γ-PCDH cluster. Variable exons of the γ-PCDH A and B subfamilies are shown in gray and black, respectively. Variable exons of the γ-PCDH C subfamily are shown in purple, γ-PCDH constant exons in blue. (b) Schematic representation of the genomic (upper panel) and protein structure (lower panel) of PCDHGC4, and localization of the identified disease-causing variants. Introns are shown by black horizontal line, coding exons by purple and blue bars, noncoding regions of exons by small blue bar (upper panel). Scale bar is referring solely to exons. Protein structure of PCDHGC4 with six extracellular cadherin (EC) repeats (purple), the transmembrane region (gray), and the intracellular domain (ICD, blue). (c) Amino acid sequence alignment of PCDHGC4 across different species including mouse Pcdhgb7 (lower line, all panels) for residues p.Asp483 and p.Ala488 (upper panel) and p.Val606 (lower panel) that are altered in the affected subjects. Protein sequences were prepared from UniProtKB and alignment was performed using Clustal Omega. Position of the altered residues in human are indicated (top numbers). (d) Three-dimensional structure of the EC3 to EC6 domains of Pcdhgb7. Structural information was obtained from the Protein Data Bank (PDB) and is available under the accession number 5v5x. Pcdhgb7 is shown in ribbon representation. β-strands are shown as arrows (blue), a short helical part in red, calcium ions in sphere representation (green), and aspartate at position 478 within the Ca2+-binding DXD motif in space filling representation (red). (e-g) Close up crossed eyes stereo views of p.Asp478 in Pcdhgb7 corresponding to p.Asp483 in PCDHGC4 (e), p.Gly483 (corresponding to p.Ala488 in PCDHGC4) (f), and p.Leu602 (corresponding to p.Val606 in PCDHGC4) (g). Affected amino acid residues are labeled in red, calcium ions are shown in sphere representation (light green), oxygen ligands of the adjacent calcium ion in space filling representation (f, dark green), surrounding hydrophobic residues p.Pro558, p.Tyr604, and p.Val644 of p.Leu602 in space filling representation in yellow (g).

