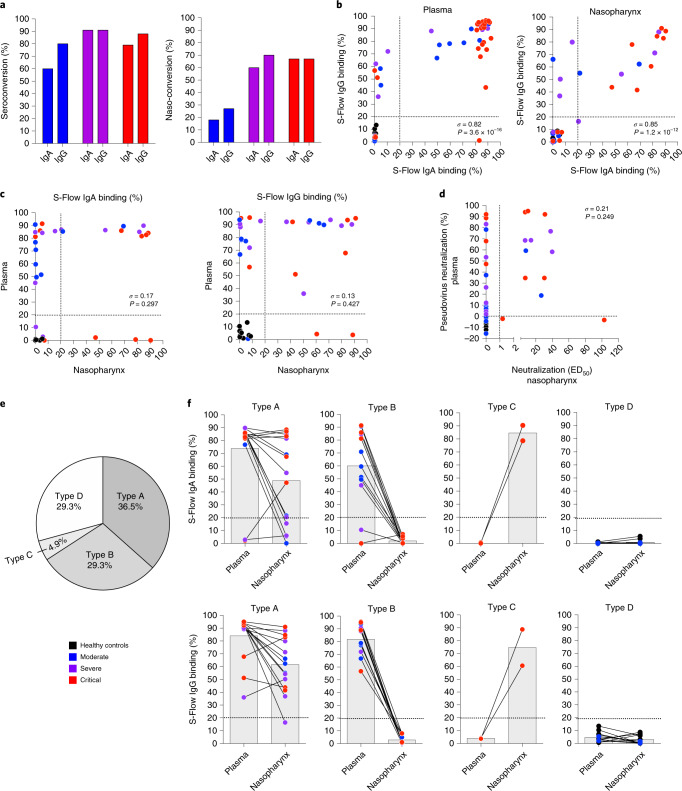
Fig. 2. Heterogeneous systemic and mucosal SARS-CoV-2 antibody responses.
a–f, IgA and IgG were assessed by S-Flow using cell lines stably expressing surface CoV-2 spike protein in plasma of healthy controls (n = 12) and patients with mild-to-moderate (n = 15), severe (n = 11) and critical (n = 23) COVID-19 or in the nasopharyngeal compartment of healthy controls (n = 10) and patients with mild-to-moderate (n = 10), severe (n = 10) and critical (n = 12) COVID-19. a, The percentage of IgA and IgG seroconversion in plasma and ‘naso-conversion’ (percentage of positive samples from the nasopharynx) versus disease severity. b, Correlation plots between the percentage of S-Flow anti-spike IgA binding and the percentage of S-Flow anti-Spike IgG binding in plasma (n = 61) and in nasopharynx (n = 42). c, Correlation plots between plasma and nasopharynx anti-spike antibody responses (n = 41). d, Correlation plot between the percentage of plasma pseudovirus neutralization and nasopharyngeal virus neutralization (ED50; n = 41). e, Representation of antibody conversion among the patients; type A represents naso-positive and seropositive patients, type B represents naso-negative and seropositive patients, type C represents naso-positive and seronegative patients and type D represents naso-negative and seronegative patients. f, Representation of anti-spike responses in the different compartment for each patient type. In b, c and d, σ represents the Spearman coefficient.

