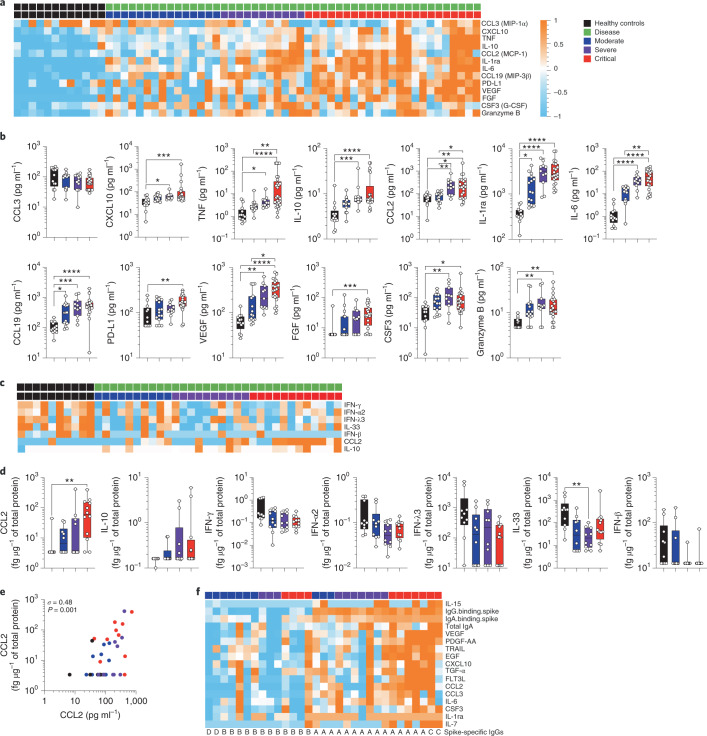
Fig. 3. Systemic and mucosal cytokine production in patients with COVID-19.
Cytokines were measured in the plasma (a and b) of healthy controls (n = 12 donors) and in patients with mild-to-moderate (n = 15), severe (n = 11) and critical (n = 23) disease or in the nasopharyngeal compartment (c and d) of healthy controls (n = 10 donors) and in patients with mild-to-moderate (n = 10), severe (n = 10) and critical (n = 12) disease using a bead-based multiplexed immunoassay system, Luminex or the digital Simoa ELISA (IFN-α, IFN-β, IFN-γ, IL-6, IL-17A, IL-10 and TNF). a,c, Heat maps of statistically different cytokines (P < 0.05) between healthy controls and patients with COVID-19 (moderate, severe and critical), ordered by hierarchical clustering. Upregulated cytokines are shown in orange and downregulated in blue. b,d, Individual cytokine concentration plots by patient severity. e, Correlation plots between CCL2 concentrations in plasma and nasopharyngeal paired samples; n = 42. σ represents the Spearman coefficient. f, Heat map of statistically different cytokines and antibodies (P < 0.05) in patients having nasopharyngeal spike-specific antibodies (type A and type C) as compared with those lacking these antibodies (type B and type D). In a, c and f, z-score scale is indicated, with upregulation shown in orange and downregulation shown in blue. P values were determined with a two-tailed Mann–Whitney test between healthy and infected individuals. In b and d, box plots show the median ± minimum to maximum values. P values were determined with the Kruskal–Wallis test followed by Dunn’s post hoc test for multiple comparisons. *P < 0.05; **P < 0.01; ***P < 0.001; ****P < 0.0001.

