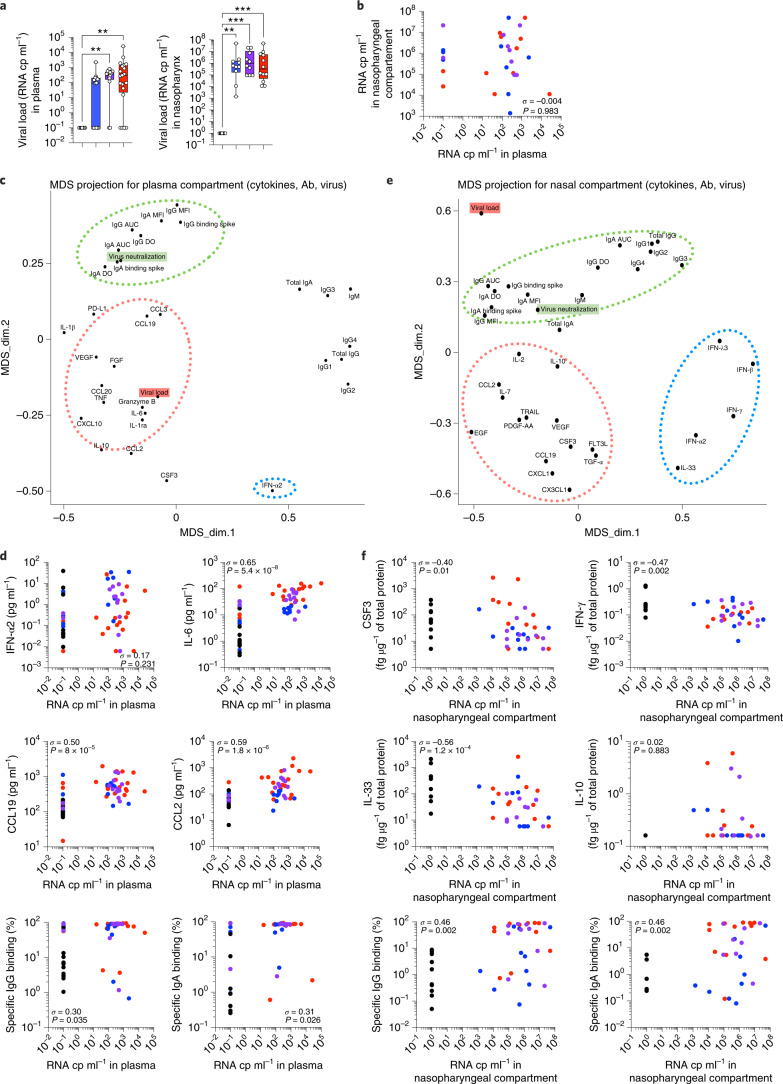
Fig. 4. SARS-CoV-2 antiviral immune responses are distinct locally and systemically.
a, Plasma viral loads evaluated by digital PCR and in nasopharyngeal swabs estimated by RT–PCR and expressed as relative copies (cp) per ml; n = 61 (left) and n = 42 (right). b, Correlation plots between viral load the in the plasma versus nasopharyngeal compartment. c,e, MDS projection for plasma compartment (cytokines, antibodies and blood viral load; c) and nasopharyngeal compartment (cytokines, antibodies and nasal viral load; e). The dotted lines represent the most associated analytes. d,f, Individual correlation plots between viral load and cytokines or antibodies. In a, box plots show the median ± minimum to maximum values. P values were determined with the Kruskal–Wallis test followed with Dunn’s post hoc test for multiple comparisons. In b (n = 42), d (n = 61) and f (n = 42), σ represents the Spearman coefficient. *P < 0.05; **P < 0.01; ***P < 0.001.

