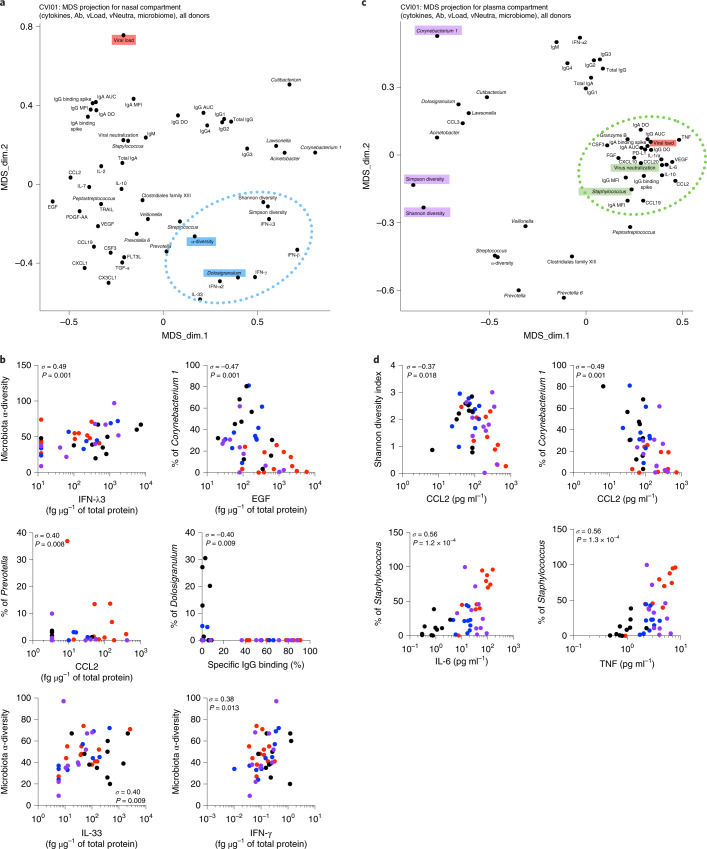
Fig. 6. Nasal microbiome influences local mucosal and systemic immune responses in patients with COVID-19.
a,c, DS projection for the nasopharyngeal compartment (cytokines, antibodies, neutralization, nasal viral load and nasal microbiome; a) and the plasma compartment (cytokines, antibodies, pseudoneutralization, blood viral load and nasal microbiome; c). The dotted lines represent the most associated analytes. b,d, Plots show individual correlations between the percentage of genus abundance and cytokines, antibodies or viral load. In b (n = 42) and d (n = 61), σ represents the Spearman coefficient. *P < 0.05; **P < 0.01; ***P < 0.001.

