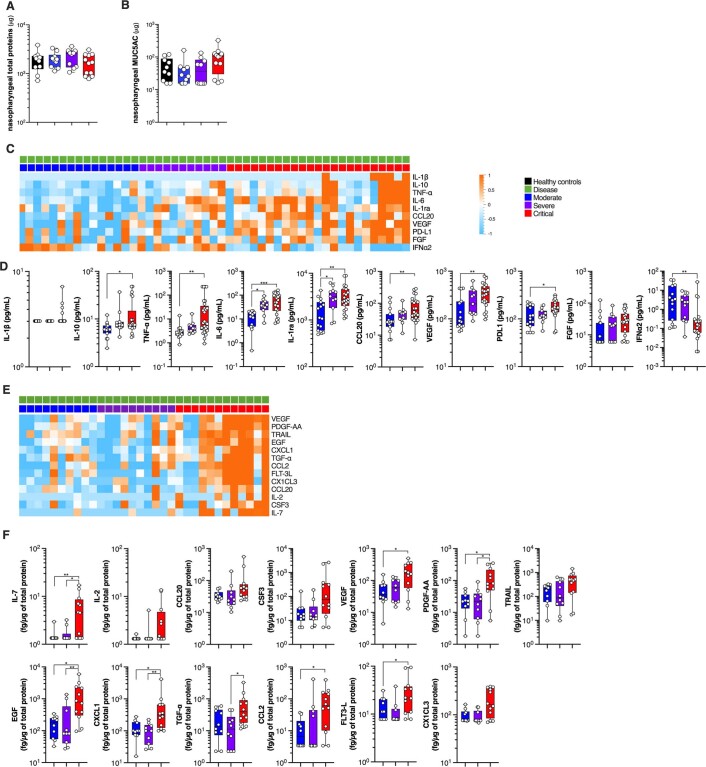
Extended Data Fig. 3. Systemic and mucosal cytokines production in COVID-19 patients.
(a) total protein (μg) content in nasopharyngeal samples. (b) MUC5AC content in nasopharyngeal samples. (c) Heatmap representation of statistically different (P < 0.05) plasma cytokines between critical COVID-19 patients and mild to moderate and severe COVID-19 patients. (d) Plasma cytokine concentration plots by patient severity. (e) Heatmap representation of statistically different (P < 0.05) nasopharyngeal cytokines between critical COVID-19 patients and mild to moderate and severe COVID-19 patients. (f) Nasopharyngeal cytokine concentration plots by patient severity. (a-f) Cytokines were measured in the plasma of healthy controls (n = 12 donors), mild to moderate (n = 15 patients), severe (n = 11 patients) and critical (n = 23 patients) or in the nasopharyngeal compartment of healthy controls (n = 10 donors), mild to moderate (n = 10 patients), severe (n = 10 patients) and critical (n = 12 patients). In (c) and (e), P values were determined with the Mann-Whitney test. In (a), (b), (d) and (f), box plots with median ± minimum to maximum. P values were determined with the one-sided Kruskal-Wallis test followed by with Dunn’s post-test for multiple group comparisons with Geisser-Greenhouse correction. For all panels: *P < 0.05; **P < 0.01; ***P < 0.001.

