
Figure 2.
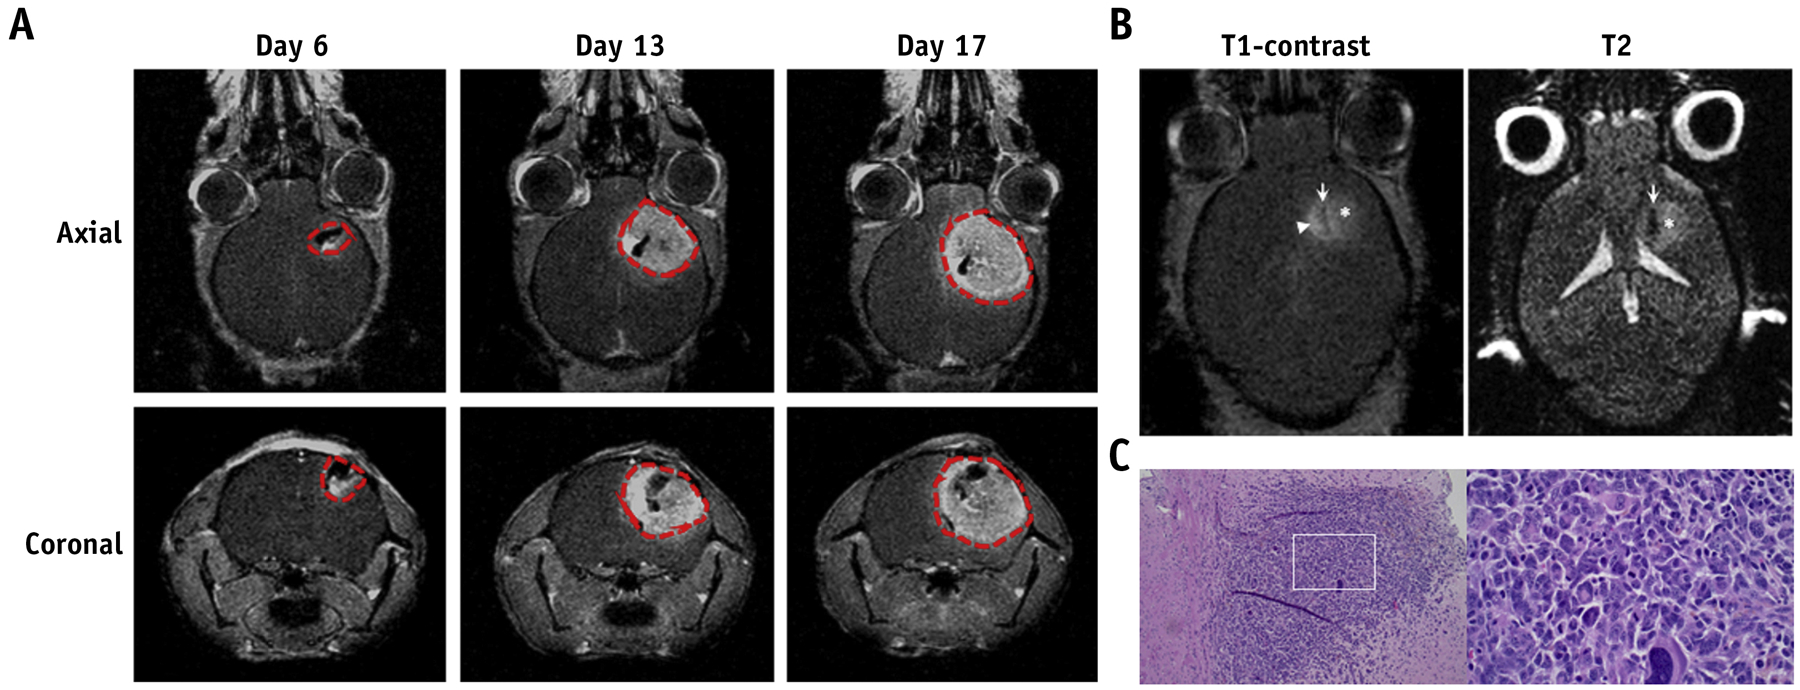
Validation of intracranial GBM model. (A) Representative T1-weighted contrast-enhanced images of mice intracranially injected with MGPP3 cells. Images were taken 6, 13, and 17 days after tumor implantation. Red dotted line: tumor cavity as defined by T1-post contrast enhancement. (B) Representative T1-weighted contrast-enhanced and non-contrast T2 images of mice 10 days after intracranial injection of MGPP3 cells. Left panel: injection tract (arrow), contrast enhancing tumor (arrowhead), and hyperintensity demonstrating peritumoral edema region (asterisk). Right panel: injection tract (arrow) and lightly hyperintense, poorly demarcated, and irregularly tumor lesion (asterisk). (C) Representative H&E staining of brain tumor showing the histological features of MGPP3-derived xenograft. Left panel: original magnification × 100; Right panel: original magnification × 400.