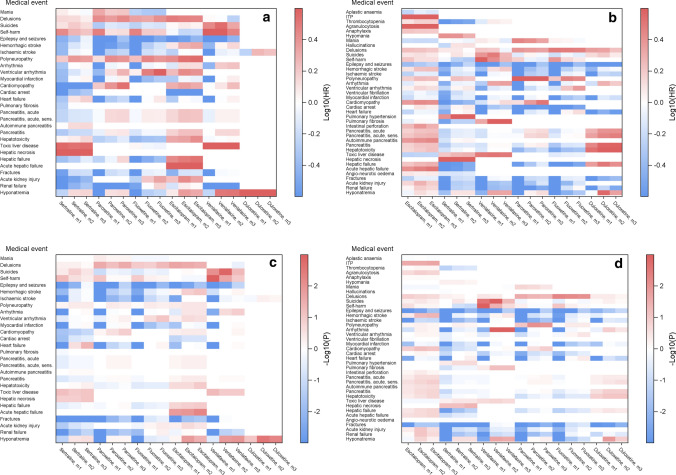
Fig. 3.
Illustration of preliminary associations of the primary analysis in all three models: crude (m1), age and sex (m2), and fully adjusted (m3) in (a, c) 2006 and (b, d) 2016. Heat maps show events occurring at least five times. Figures (a) and (b) are colored by log10 of the hazard ratio (log10(HR)) ranging from − 0.6 to 0.6 that correspond to HR of 0.25 and 4. Other relevant values of the log10(HR) are − 0.3, 0.0, and 0.3, corresponding to HRs of 0.5, 1.0, and 2. Darker red indicates a more positive association, and darker blue indicates more negative associations. Figures (c) and (d) are colored by significance as log10 of the p value (− log(P)) that ranges from − 3 to 3, both corresponding to p values of 0.001, but for negative associations and positive associations, respectively. Other relevant values are − 2 and 2, corresponding to p values of 0.01 and − 1.3 and 1.3 corresponding to p values of 0.05. a Colored by log10 of the HR in 2006, b Colored by log10 of the HR in 2016, c colored by significance as log10 of the p value in 2006, d colored by significance as log10 of the p value in 2016. HR hazard ratio, ITP immune thrombocytopenic purpura, sens sensitivity

