Fig. 1.
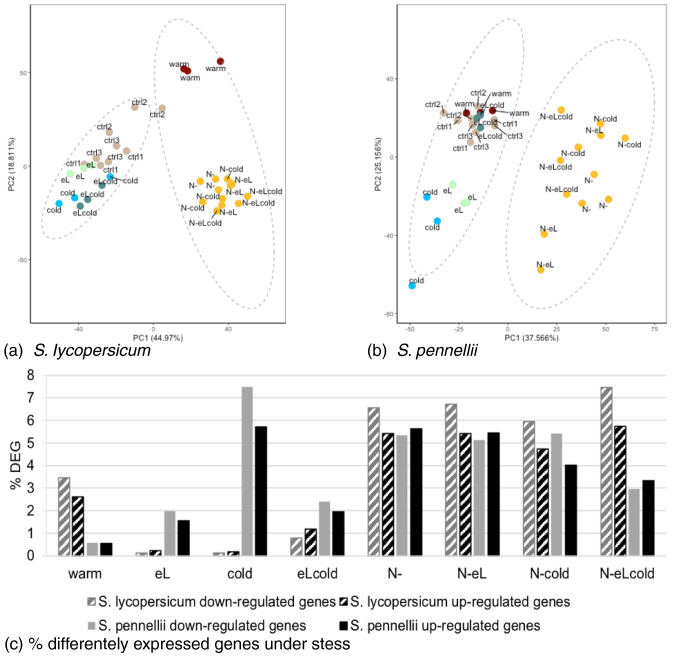
RNASeq analysis reveals different responses to temperature changes in the two tomato species. Total RNA was extracted from harvested material of day 7. a and b Principal component analysis (PCA) for S. lycopersicum (a) and S. pennellii (b) indicating responsivness to the stress treatments, shown by comparison of principal component 1 (PC1) versus principal component 2 (PC2). Control samples are indicated in brown, cold samples in blue, warm samples in red, elevated light samples in light green, and all samples comprising nitrogen deficiency in orange. c Percentage of differentaly expressed genes (DEG) in S. lycopersicum (striped columns) and S. pennellii (plain columns). Differentially expressed genes were obtained by global comparison of expression data for the stress treatment with the respective control sample. Percentage of down-regulated genes is shown in grey bars, and up-regulated genes in black bars, respectively. FDR < 0.01

