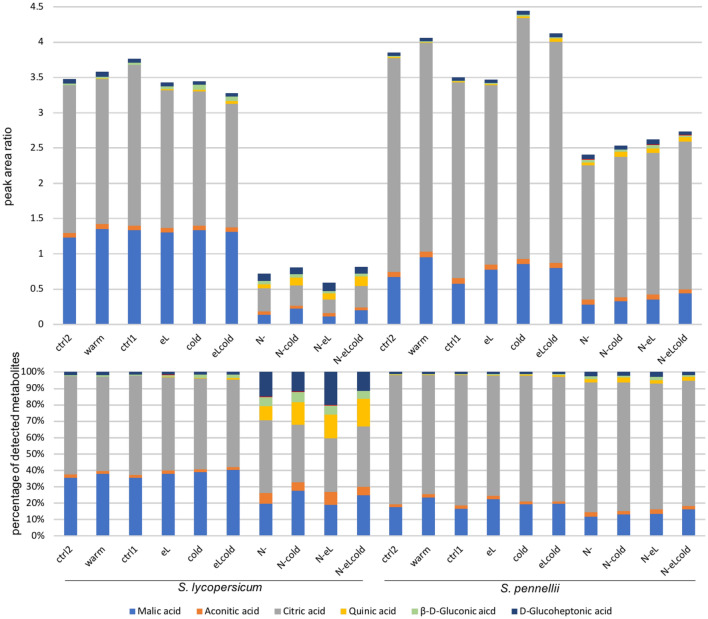
Fig. 5.
The two tomato species responded similar for a set of primary metabolites obtained by ESI(−) mode. Samples used for the RNASeq analysis and the qPCR verification were also used for determination of metabolites by LC–FTICR–MS and LC–ESI(−)–MS/MS. Malic acid, aconitic acid, citric acid, quinic acid, gluconic acid and glucoheptonic acid were unambiguously identified. Quantification of them was performed with LC–MS/MS by use of their corresponding MRM transitions. Peak area ratios (above) and their normalized illustration (below) are shown as mean of two independent biological experiments

