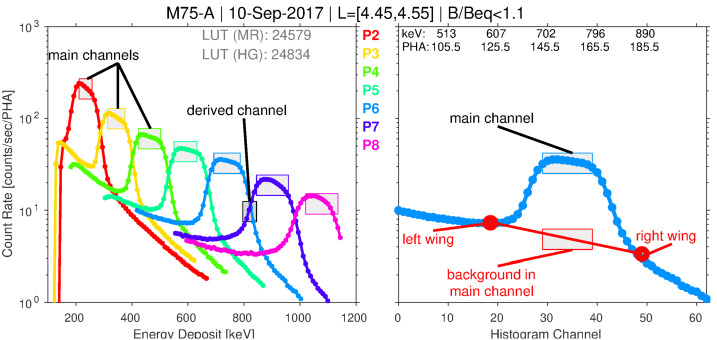
Fig. 10.
Left: Spin-averaged histogram data from pixels 2–8 on the M75-A unit averaged in the indicated and range on 10 Sep 2017. The main rate channel boundaries, defined via the main rate LUT for each pixel, are indicated with a shaded box (the height of each box is arbitrarily chosen). One of the 6 derived channels, between P6 and P7, is also indicated. Right: One of the pixels from the left panel (P6), now plotted versus histogram channel number, 0–63, with the corresponding PHA channels and energy deposit values indicated along the top horizontal scale. Various parameters used in the background corrections are also labeled (red)

