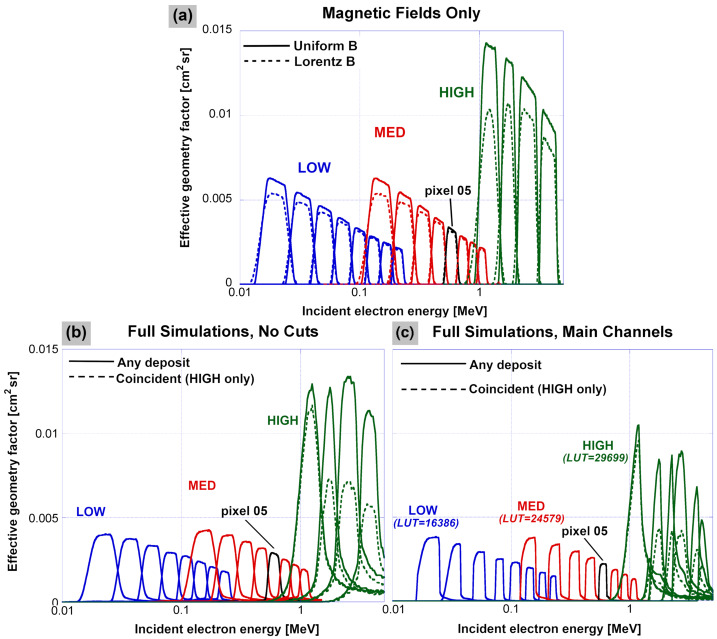
Fig. 13.
(a) Simulated response of each pixel for the three units, considering only transport from the slit to the detector plane through the magnetic field in the chamber. Pixels P1–P8 are shown for LOW and MED (P0 omitted) and P0–P3 are shown for HIGH; MED P5 (e.g., Fig. 12a) is shown in black rather than red. Solid lines are for simulations conducted with a uniform chamber magnetic field of 550, 1600, and 4800 Gauss for LOW, MED, and HIGH, respectively. Dashed lines are for simulations conducted with the LORENTZ field as modeled before launch for each unit and scaled to those three mean values. (b) Same as in (a), but with full realism of the simulation, including the LORENTZ field and non-ideal effects (e.g., scattering). Solid lines represent response to electrons depositing any amount of energy in the pixels. For the HIGH unit, the dashed lines show the effect of the coincidence requirement. (c) Same as in (b), but with a set of main rate LUTs applied to the simulation results

