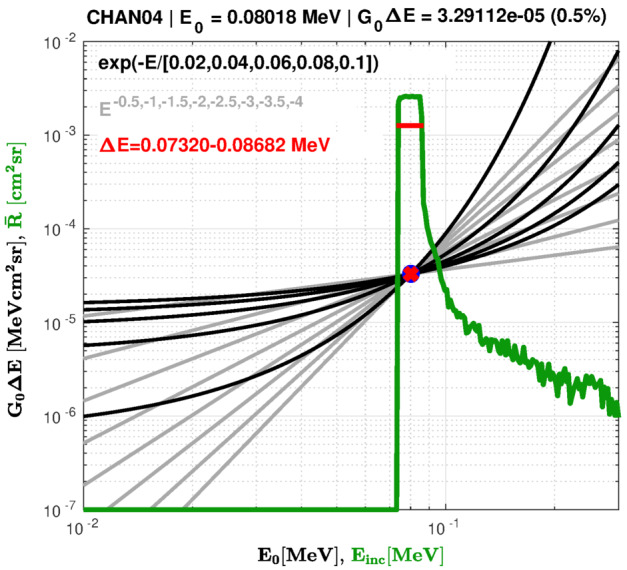
Fig. 14.

Example of the bowtie analysis for a single main rate channel () from LOW-A (LUT 16386). The green curve is the simulated isotropic pixel response and the black and grey curves are the candidate exponential and power law bowtie spectra (), respectively. The red line marks the energy channel width and the red dot marks the energy channel centroid, . Note that the labels on the horizontal and vertical scales are different for the isotropic response and the candidate spectra. The response curve is the simulated isotropic response () plotted against incident electron energy (), while the candidate spectra are bowtie response parameter () vs. bowtie energy centroid ()
