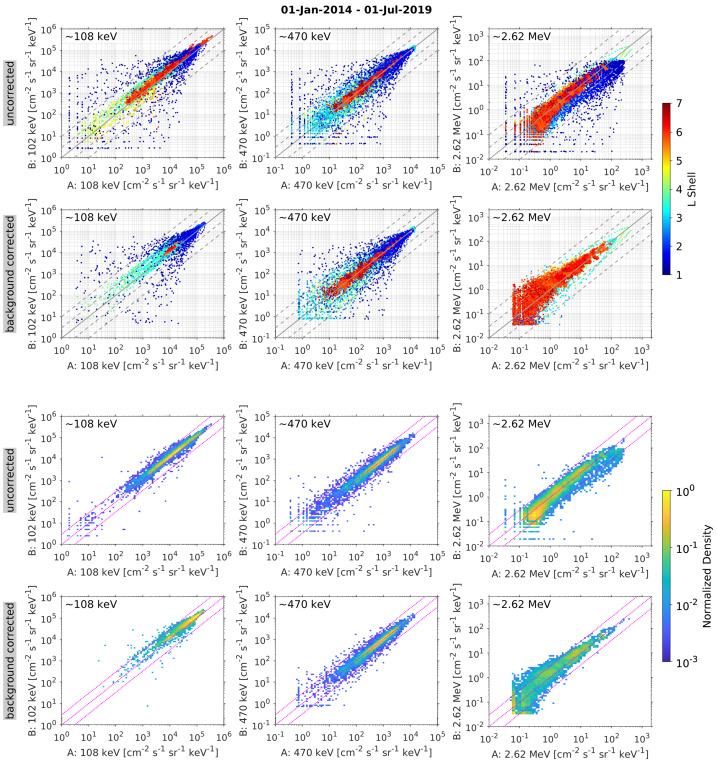
Fig. 19.
Scatter plot comparisons between MagEIS-A and -B at three selected energy channels from LOW, M75, and HIGH (columns) for uncorrected and background-corrected data (rows). These spin-averaged fluxes are shown for all conjunctions identified between 01 Jan 2014 and 01 Jul 2019. In the upper set of 6 panels, each point is color-coded by value and guidelines are shown indicating factors of 1, 3, and 10 difference. In the lower set of 6 panels, a 2D, normalized point-density is shown using a different color map, with only the factors of 1 and 3 guidelines shown (in magenta). The point-density is normalized by the maximum value in the domain and values that correspond to point per bin are omitted

