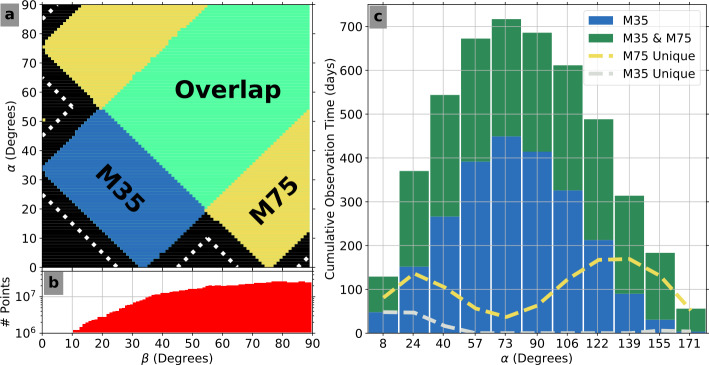
Fig. 27.
Summary of M35 vs. M75 pitch angle coverage from Probe-B. (a) The 0–90 degree local pitch angle () coverage vs. the angle between the spin axis and the magnetic field (). Regions only observed by M35 are shown in blue, only by M75 in yellow, and observed by both in green. Dashed lines indicate the original, anticipated (pre-flight) boundaries from Fig. 12 of Blake et al. (2013). (b) The occurrence frequency of over the entire mission. (c) The cumulative observation time in each pitch angle bin measured using M35 only (blue) and using both M75 and M35 (green). The dashed lines show only the unique observations for M35 (grey) and M75 (yellow)

