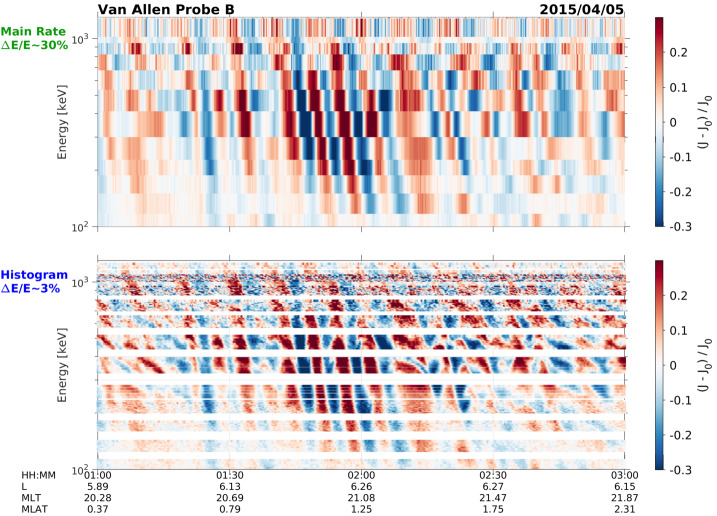
Fig. 7.
MagEIS residual flux (perturbations from the mean) oscillations plotted versus time (horizontal) and energy (vertical). (Top) ULF drift-resonance signature in the main channel data. (Bottom) The same signature in the high-energy resolution MagEIS histogram data, where each main channel is further subdivided into energy channels. Adapted from Hartinger et al. (2018) ©The American Geophysical Union, but shown here with the fully-calibrated histogram data (see Sect. 4.2)

