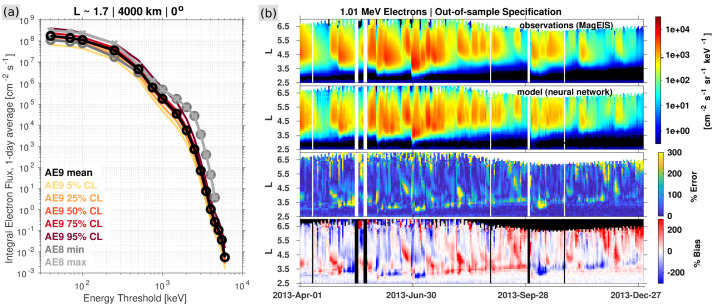
Fig. 8.
(a) Illustration of the effect that MagEIS data inclusion has on the AE9 climatology model, relative to the legacy AE8 model, for the orbital parameters indicated. The AE8 model is shown in both solar minimum and maximum states. The AE9 model is shown in its mean state, along with confidence levels (CL) from 100 perturbed mean scenarios. (b) Summary of the SHELLS neural network model performance for an out-of-sample specification of 1 MeV electron flux. The four panels show MagEIS observations, the SHELLS model (nowcast), and the percent error and bias between the model and the observations. After Claudepierre and O’Brien (2020) ©The American Geophysical Union

