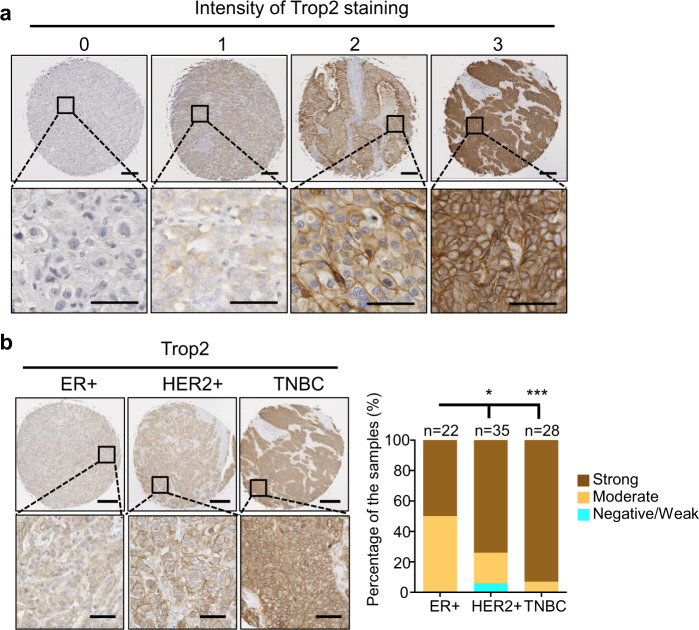
Fig. 1. Trop2 is highly expressed in breast cancer.
a Representative images of Trop2 staining intensity scores. Trop2 staining intensity is scored from 0 to 3. Scale bar represents 250 µm (upper panel) and 50 µm (lower panel). b Trop2 IHC staining on TMA including ER+ (n = 22), HER2+ (n = 35), and TNBC (n = 28) tissue samples. Representative images of ER+, HER2+, and TNBC samples (left) and Trop2 staining intensity distribution in ER+, HER2+, TNBC samples as percentages are demonstrated (right). Scale bar represents 250 and 50 µm for upper and lower panels. The statistical significance of the differences between population proportions was calculated by the normal distribution N (0,1) of the Z-score. Error bars represent standard deviation (SD). *P < 0.05, ***P < 0.001.

