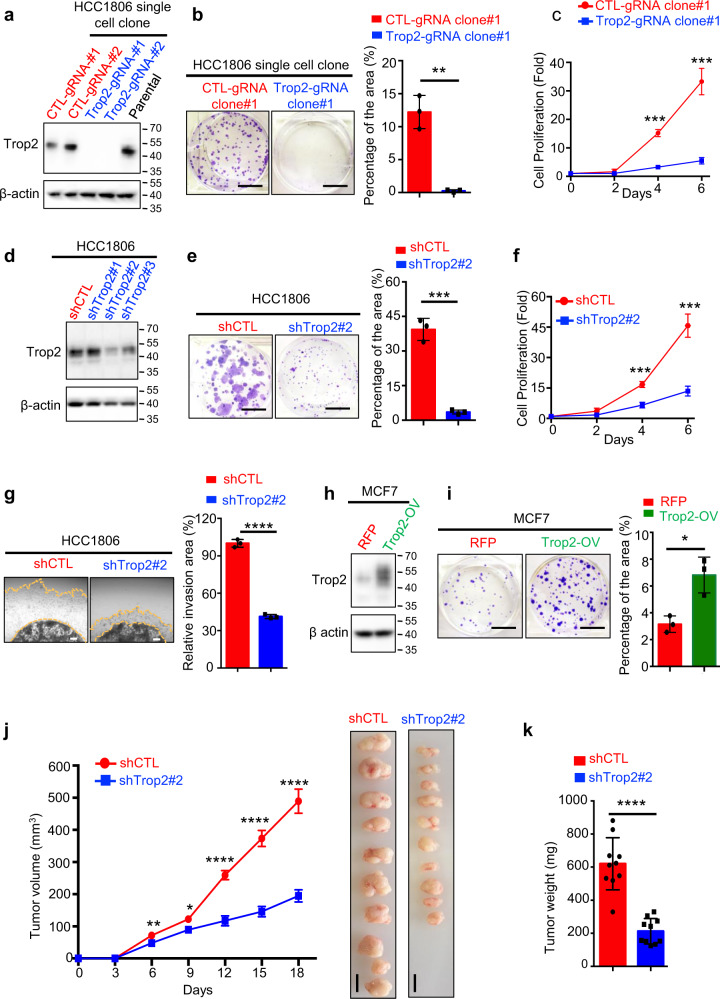
Fig. 2. Trop2 regulates TNBC cell and tumor growth in vitro and in vivo.
a Trop2 levels in HCC1806 control (CTL-gRNA-#1 and CTL-gRNA-#2), Trop2 gene deletion (Trop2-gRNA-#1 and Trop2-gRNA-#2), and parental cell lines were evaluated by western blot. The two blots were derived from the same experiment and were processed in parallel. The whole blots are shown in Supplementary Fig. 11a. b Colony formation assay of HCC1806 control and Trop2-gRNA-#1 cell lines. Representative images of wells after harvesting and staining with crystal violet (left) and quantification of percent area (right) are shown. The scale bar is 1 cm. Error bars represent SD. c Proliferation assay of HCC1806 control and Trop2-gRNA-#1 cells are presented as fold change over Day 0. Quantification measures cell count. d Trop2 levels in HCC1806 shCTL, and Trop2 knockdown cells (shTrop2#1, shTrop2#2, and shTrop2#3) were measured by western blot. The two blots were derived from the same experiment and were processed in parallel. The whole blots are included in Supplementary Fig. 11b. e Colony formation assays of HCC1806 shCTL and shTrop2#2 cells. Representative images of harvested wells stained with crystal violet (left) and the quantification of percent area (right) are shown. Scale bars represent 1 cm. Error bars represent SD. f Proliferation assay of HCC1806 shCTL and shTrop2#2 and cells, demonstrated as fold change based on the cell number of individual cell lines at Day 0. Quantification measures cell count and it is shown as fold change over Day 0. Error bars represent SD. g 3-D Matrigel drop invasion assay of HCC1806 shCTL and shTrop2#2. Representative images of the cells invaded area outside the drop (left), and quantification of percent invasion area relative to the shCTL (right) are demonstrated. Scale bars represent 250 µm. Error bars represent SD. h Trop2 protein levels in MCF7 cells stably expressing RFP or Trop2 and RFP were measured by western blot. The two blots were derived from the same experiment and were processed in parallel. The whole blots are shown in Supplementary Fig. 11c. i Colony formation assay of MCF7-RFP and MCF7-Trop2-OV. Representative images of harvested wells stained with crystal violet (left) and quantification of percent area (right) are shown. Scale bars represent 1 cm. Error bars represent SD. j Tumor volumes of HCC1806 shCTL (n = 10) and shTrop2#2 (n = 10) subcutaneously implanted xenografts in female NSG mice (left). Volumes measured every three days with calipers and quantified (length × width × height)/2. Tumor images at the experimental endpoint are shown (right). Error bars represent standard error (SE). k End of study tumor weights was measured and plotted (right). Scale bars represent 1 cm. Error bars represent SE. *P < 0.05, **P < 0.01, ***P < 0.001, and ****P < 0.0001 are derived from two-tailed Student’s t test.

