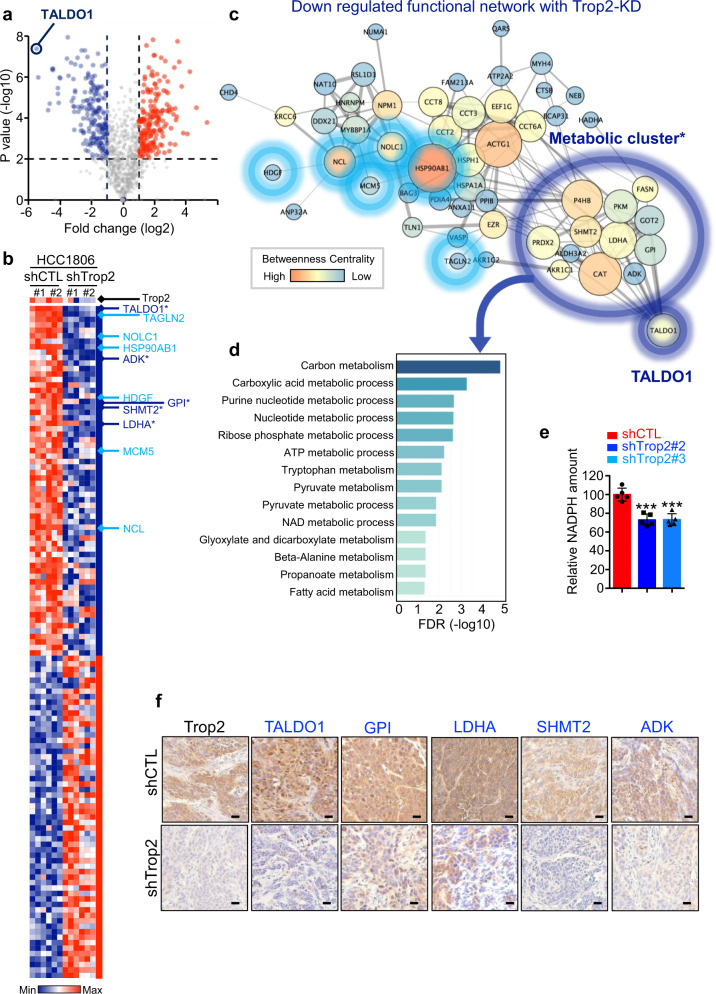
Fig. 3. Trop2 knockdown modulates a set of metabolic proteins and known oncogenes in TNBC.
HCC1806 shCTL and shTrop2 xenograft tumors (n = 2 per group) were analyzed in triplicate by liquid chromatography–tandem mass spectrometry (LC–MS/MS). a Volcano plot illustrating the increased and decreased proteins and dotted lines indicating P value < 0.01 and fold change > 2-fold. Blue represents decreased proteins; red represents increased proteins. b Heatmap demonstrating protein fold changes upon modulation of Trop2 (n = 64, fold change > 2, and P value < 0.01). Known oncogenic proteins (light blue), and metabolism-related proteins (dark blue, with stars) are indicated. In the heat map blue indicates decreased proteins; red indicates increased proteins. c Functional network analysis of decreased proteins upon Trop2 knockdown was performed by STRING (https://string-db.org/)71 and drawn with Cytoscape software 3.7.2.28 with yFiles Organic Layout. Proteins that belong to functional networks are shown. Top downregulated protein, TALDO1, is used to identify the associated metabolic cluster (* first neighbors of TALDO1). Known oncogenic proteins are noted with light blue circles, and the metabolic cluster is indicated in dark blue circles. The line thickness provides the strength of data support from the STRING database. The node size indicates neighborhood connectivity, and the node color represents betweenness centrality, which was generated from statistics of network analysis with Cytoscape software. d Functional enrichment analysis is summarized as a bar graph with false discovery rate (FDR) of Trop2 downregulated proteins in the Gene Ontology (GO). e NADPH quantification of HCC1806 shCTL, shTrop2#2, and shTrop2#3 cell lines. Relative luminescence represents the NADPH amount that is measured by NADP/NADPH-GloTM assay. Error bars represent SD, ***P < 0.001 derived from two-tailed Student’s t test. f IHC staining for Trop2, TALDO1, GPI, LDHA, SHMT2, and ADK in HCC1806 shCTL and shTrop2 xenografts. Scale bar represents 20 µm.

