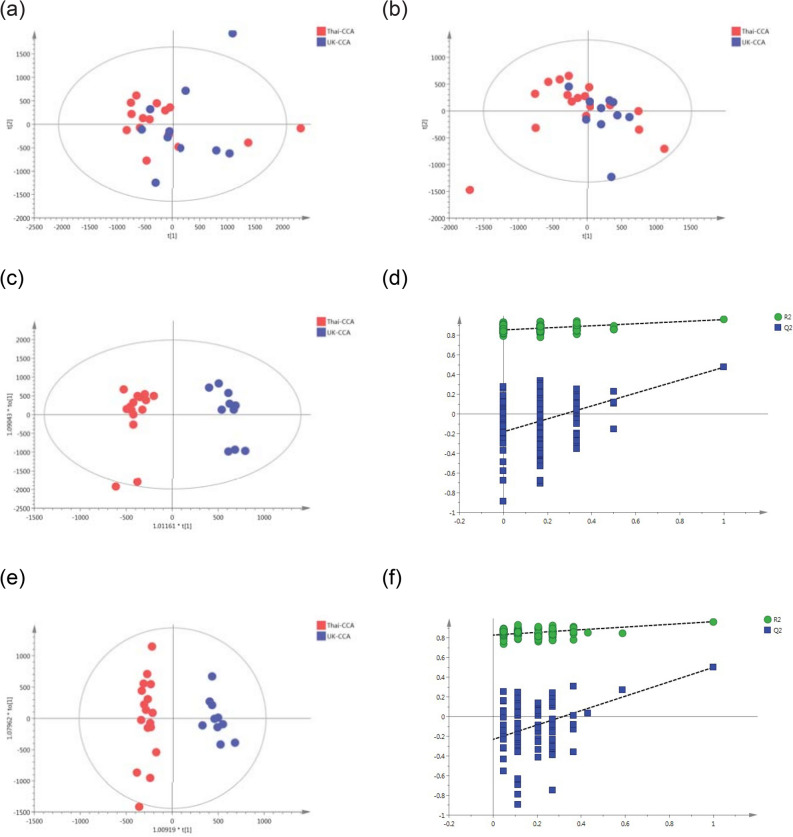
Figure 2.
PCA scores plots for (a) positive and (b) negative ion mode data of CCA patients from Thailand and United Kingdom. OPLS-DA scores plots showing group separation for both (c) positive and (d) negative ion mode data and the corresponding permutation tests for (e) positive and (f) negative ion mode data. (a) PCA scores plot—positive mode R2X = 22% and Q2X = − 2% from 2 PC model; (b) PCA scores plot—negative mode R2X = 27% and Q2X = − 4% from 2 PC model; (c) OPLS-DA scores plot—positive mode R2Y = 96%, R2X = 20% and Q2Y = 48% , from one predictive and one orthogonal components model; (d) OPLS-DA scores plot—negative mode R2Y = 97%, R2X = 21% and Q2Y = 50%, from one predictive and one orthogonal components model; (e) Permutation test—positive mode CV-ANOVA = 0.009; (f) Permutation test—negative mode CV-ANOVA = 0.003.

