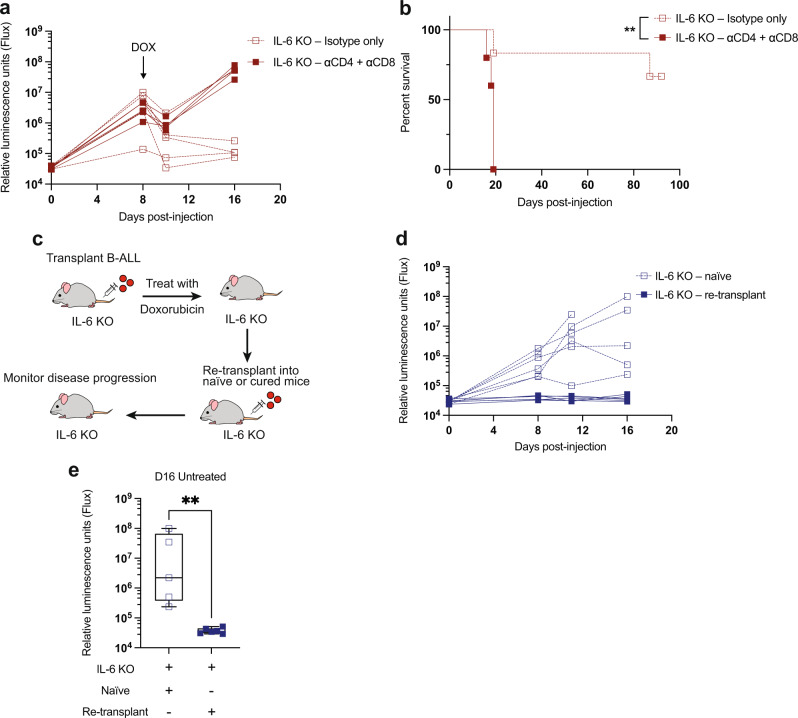
Fig. 4. T-cell-dependent anti-tumor immunity develops after doxorubicin treatment of IL-6 KO leukemic mice.
a A graph showing leukemia burden in vivo monitored by bioluminescence imaging. CD4 and CD8 cells were depleted with antibodies and response to doxorubicin (DOX) treatment was followed. n = 5 per cohort. b A Kaplan–Meier survival curve showing leukemic IL-6 KO mice treated as in (a). n = 6 for IL-6 KO-isotype, n = 5 for IL-6 KO-depleted. **p = 0.0059 by Log-rank (Mantel-Cox) test. c IL-6 KO mice previously cured (living > 80 days) by doxorubicin treatment were re-transplanted with leukemia cells and disease progression monitored by bioluminescence imaging in the absence of further treatment. d A graph showing leukemia burden in vivo in control and re-transplanted leukemia-bearing mice. n = 6 per cohort. e A graph showing leukemic IL-6 KO mice as in (e), D16 after disease transplant in the absence of treatment. At this time point, n = 5 for IL-6 KO-naive, n = 6 for IL-6 KO-re-transplant. **p = 0.0043 by two-tailed Mann–Whitney test. Boxplots show the median as the center lines, upper and lower quartiles as box limits, and whiskers represent maximum and minimum values. D8 = Day 8, D16 = Day 16. Source data are provided as a ‘Source data’ file.

