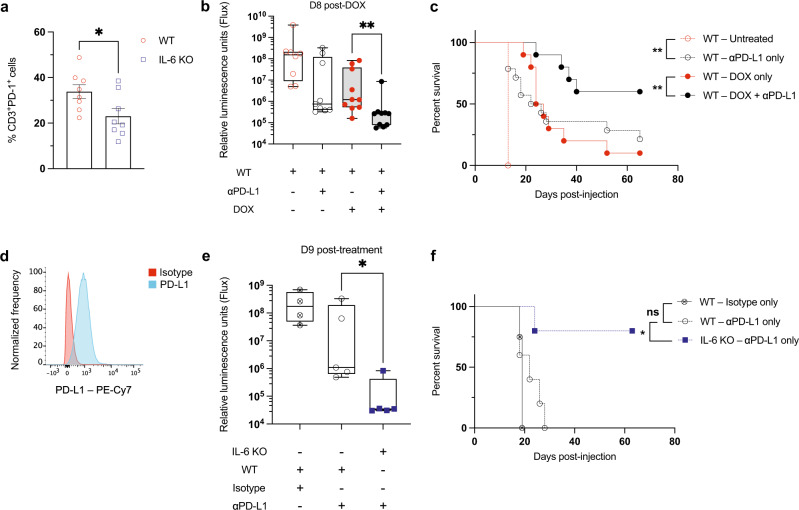
Fig. 5. Combination treatment with doxorubicin and PD-L1 inhibition increases mouse survival, while IL-6 inhibits the efficacy of PD-L1 inhibition.
a A graph showing CD3+ T-cell–PD-1+ percentages in the bone marrow of tumor-free WT mice in the absence of treatment. *p = 0.032 by two-tailed Student t-test. b A graph showing leukemia burden in vivo monitored by bioluminescence imaging. n = 10 per cohort, except n = 9 for both WT-untreated and WT-αPD-L1. **p = 0.0029 by two-tailed Mann–Whitney test. c A Kaplan–Meier survival curve showing leukemic WT mice. n = 10 per cohort, except n = 5 for WT-untreated, n = 14 for WT-αPD-L1. **p = 0.0029 between WT-untreated and WT-αPD-L1 only, **p = 0.0071 between WT-doxorubicin only and WT-doxorubicin + αPD-L1, by Log-rank (Mantel-Cox) test. d A flow cytometry plot showing PD-L1 expression on the surface of leukemic cells in vitro. e A graph showing leukemia burden in vivo monitored by bioluminescence imaging. n = 5 per cohort, except n = 4 for WT-isotype. *p = 0.0317 by two-tailed Mann–Whitney test. f A Kaplan–Meier survival curve showing leukemic WT and IL-6 KO mice. n = 5 per cohort, except n = 4 for WT-isotype. *p = 0.0126 by Log-rank (Mantel-Cox) test. Boxplots show the median as the center lines, upper and lower quartiles as box limits, and whiskers represent maximum and minimum values. D8 = Day 8, D9 = Day 9. Source data are provided as a ‘Source data’ file.

