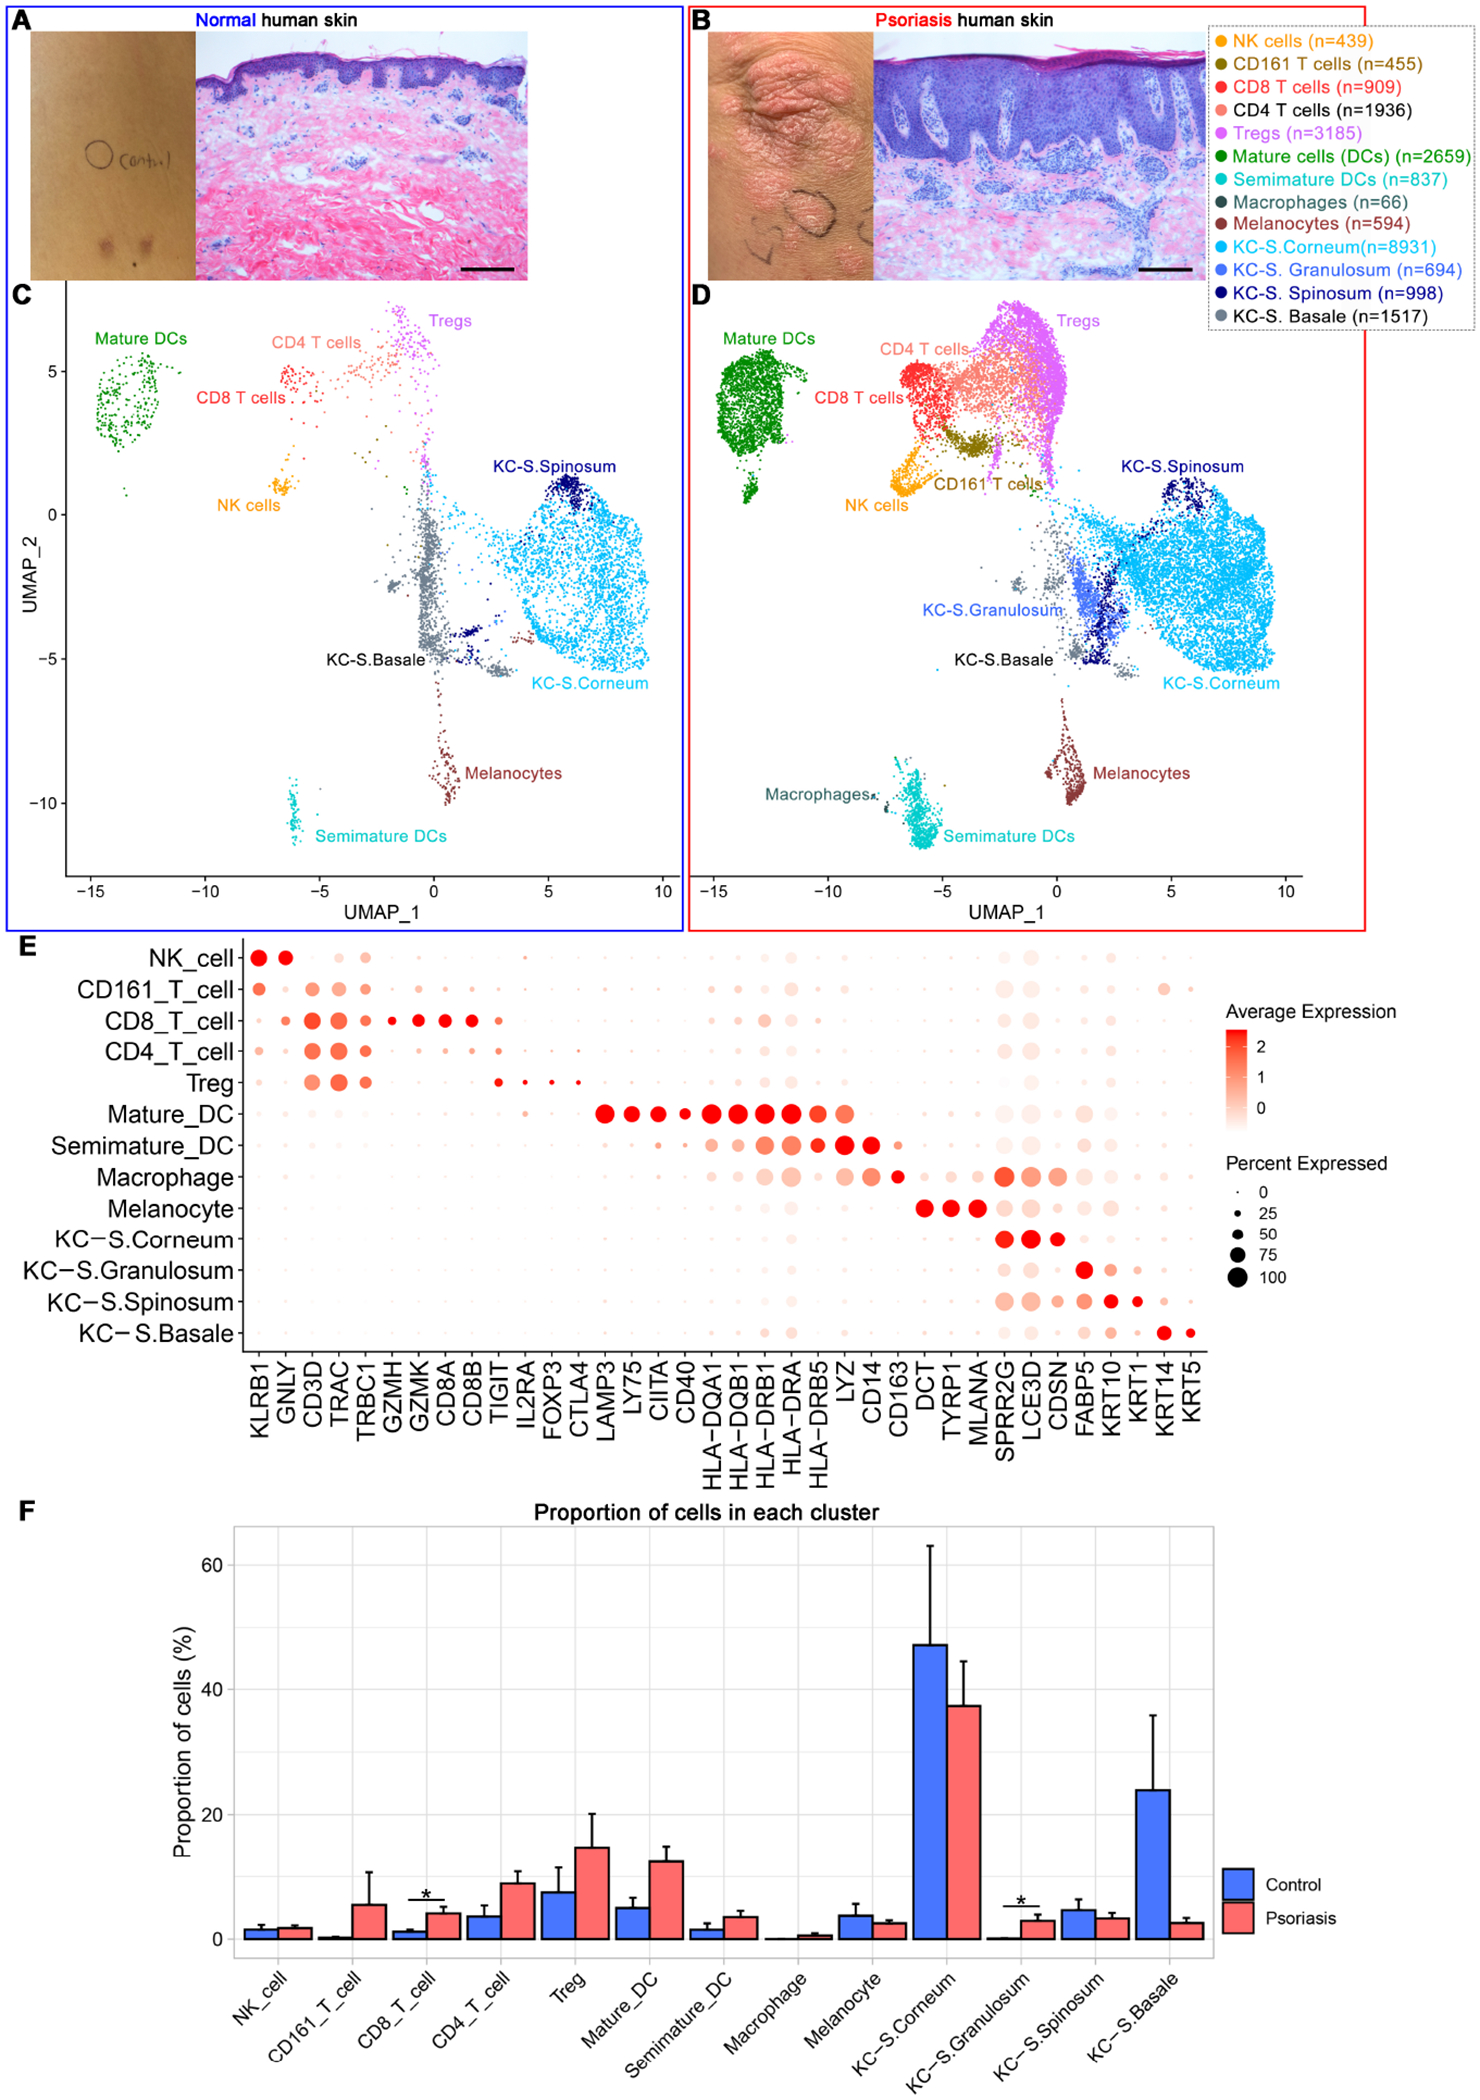
Figure 1. Single-cell transcriptomic profiling of leukocytes and keratinocytes in human psoriasis and control skin.

Clinical & microscopic figures of control (A) and psoriasis skin (B) and their leukocyte & keratinocyte scRNA-seq data presented in the Uniform Manifold Approximation and Projection plot (C and D). (E) Dot plot displaying expression levels of cluster-defining genes. (F) Cell composition of individual samples. Treg, regulatory T-cell; DCs, dendritic cells; KC, keratinocytes, S, Stratum. Scale bar in (A) and (B) = 200 μm, Proportion of cells in (F) = average number of cells in cluster within individual sample / total number of cells within individual sample x 100 (%), Error bar in (F) = Standard Error of Mean.
