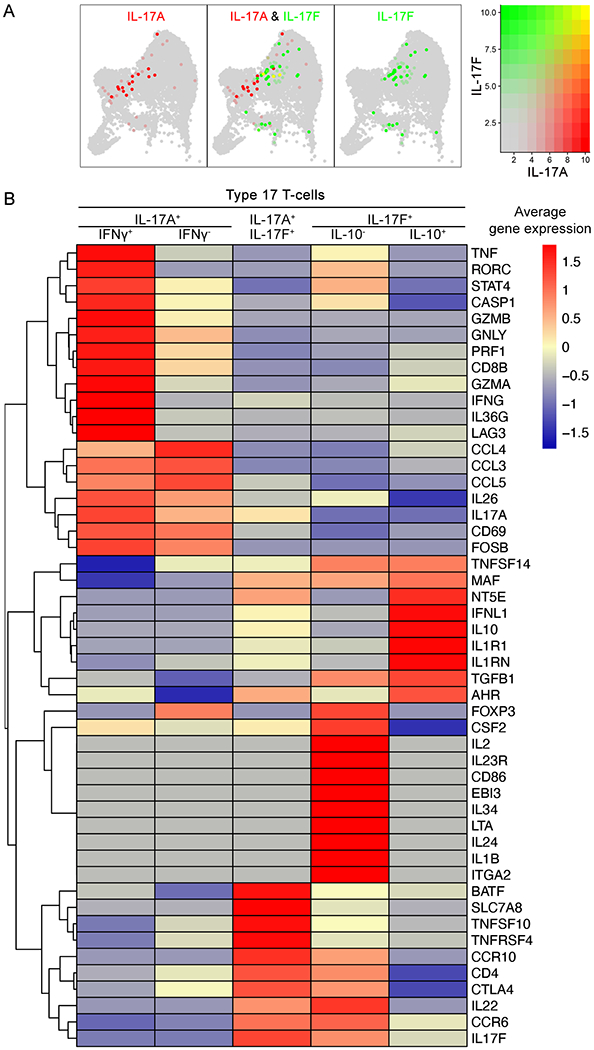
Figure 3. The average gene expression of cutaneous Type 17 T-cell (T17 cell) subsets.

(A) IL-17A (red), IL-17F (green) and IL-17A/IL17F co-expression (yellow) within T-cell subset clusters visualized in low-dimensional space. (B) Heatmap of scRNA-seq analysis illustrates the average gene expression of T17 cell subsets. Genes with similar expression patterns are linked by a complete linkage method.
