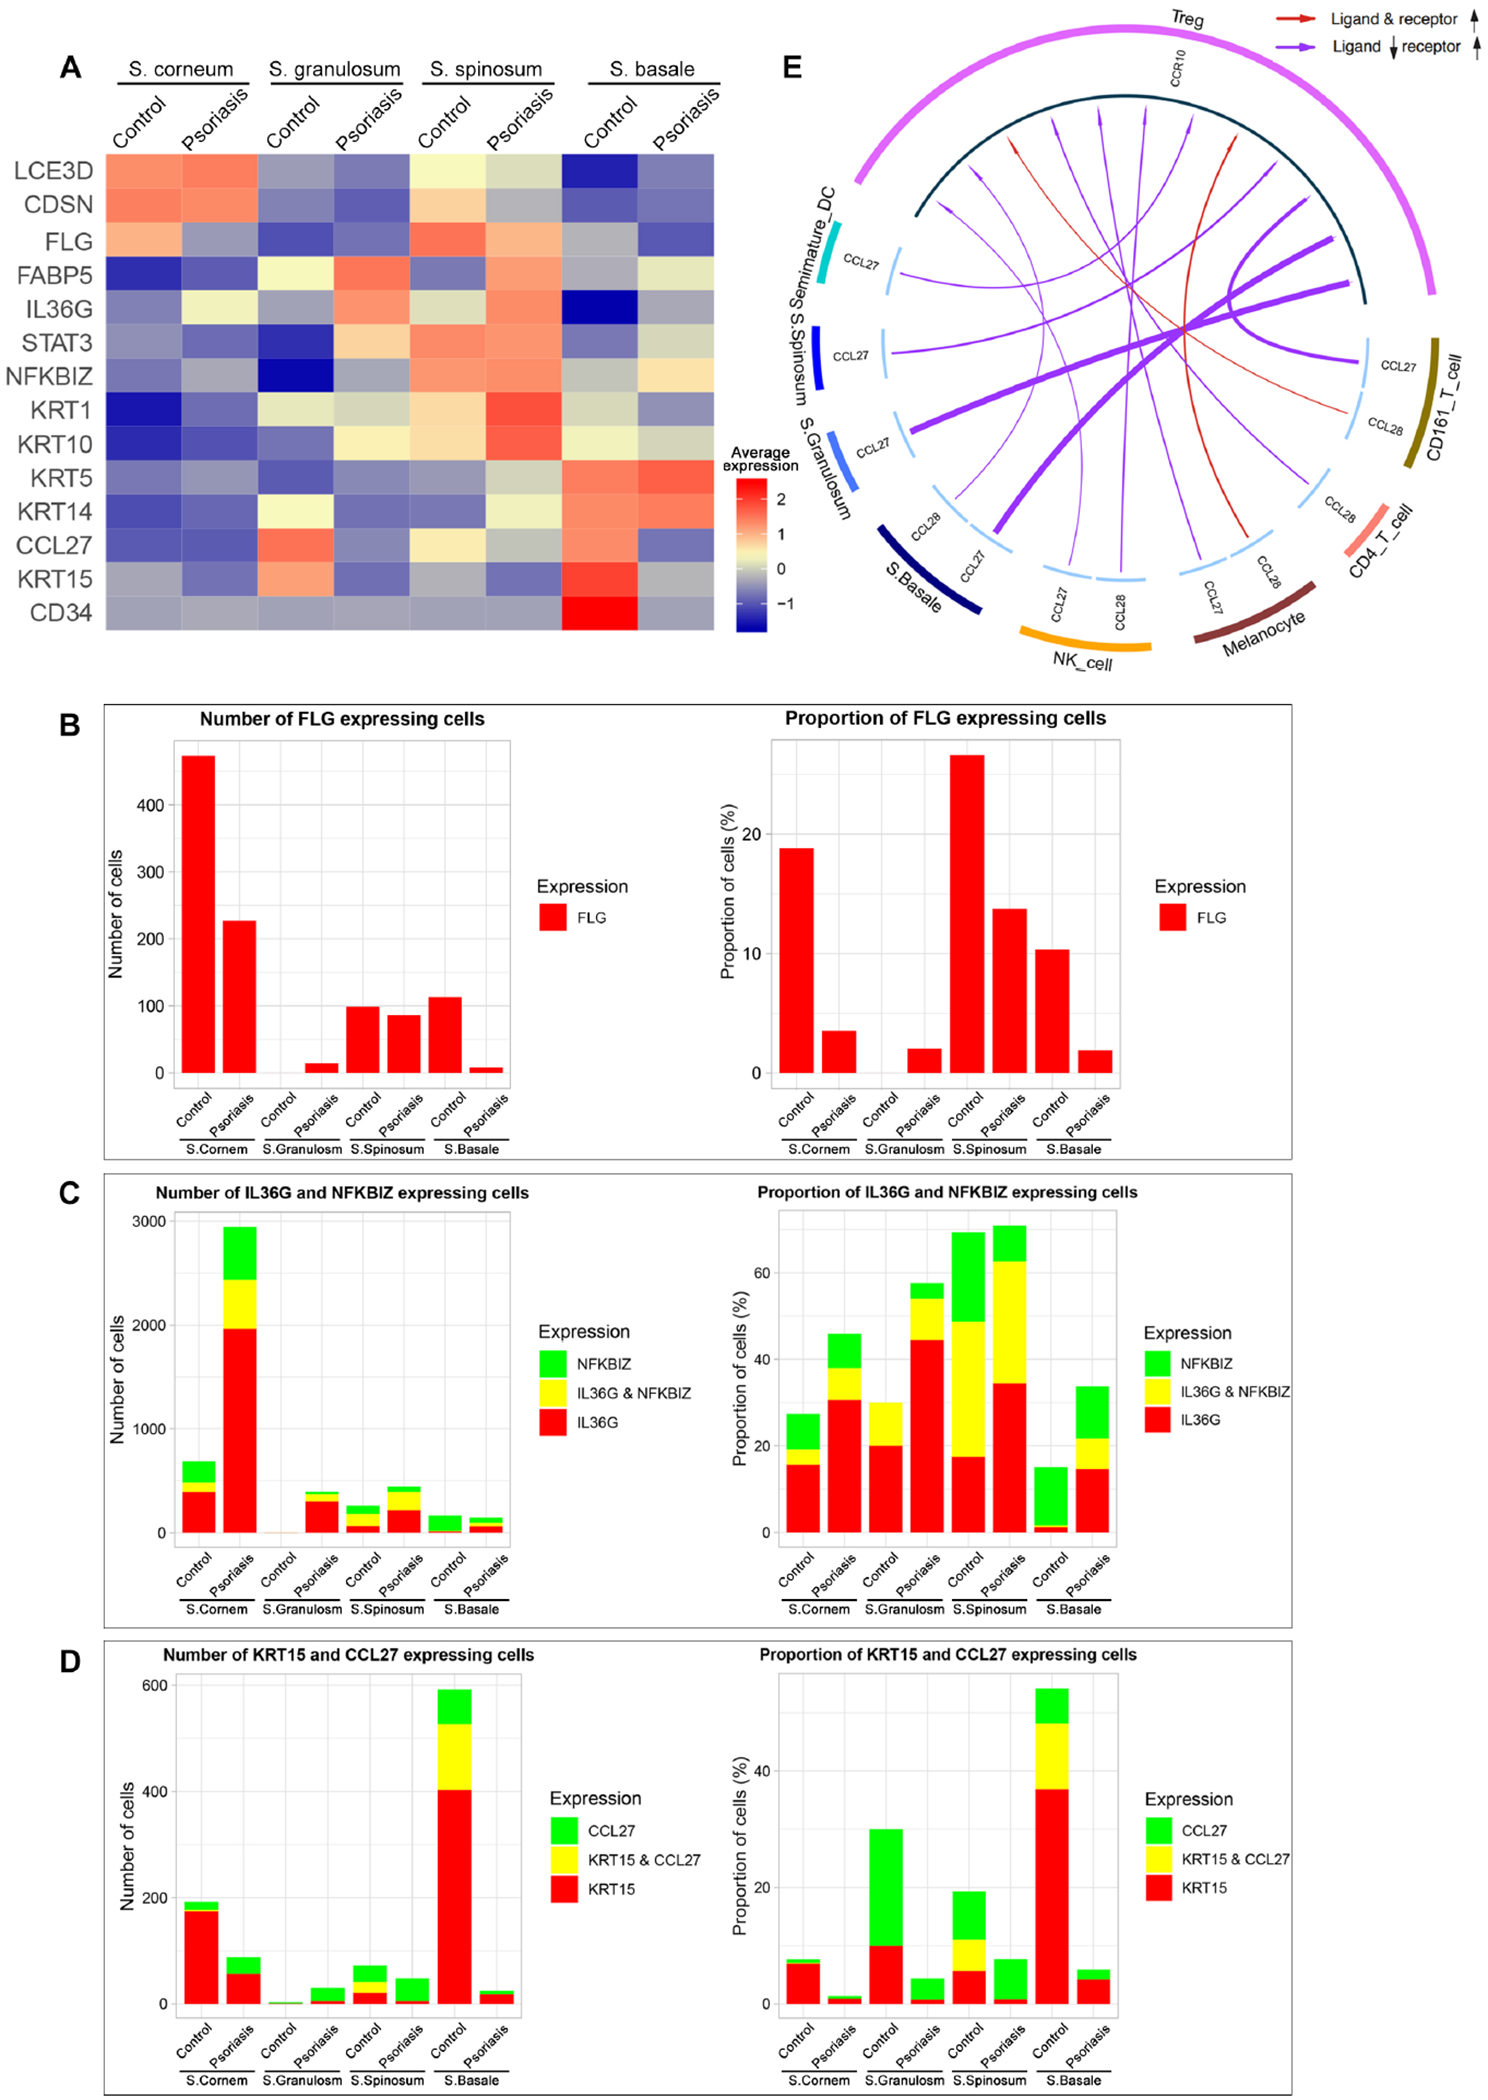
Figure 6. Gene expression within keratinocyte clusters and CCL27 (keratinocyte)–CCR10 (Treg) interactions.

(A) Heatmap of scRNA-seq analysis illustrates the average gene expression within clusters of keratinocytes (KCs) in Stratum (S.) corneum, S. granulosum, S. spinosum and S. basale, split by psoriasis and control. Cells with expression of FLG (B), IL-36G & NFKBIZ (C) and KRT15 & CCL27 (D) within each layer of KCs in control and psoriasis epidermis are quantified by number of cells and proportion of cells. Proportion of cells = number of target gene expressing cells within cluster / total number of cells within cluster x 100 (%). (E) CCL27/CCL28-CCR10 interaction in psoriasis compared to control highlights decreased CCL27 in basal keratinocytes interacting with CCR10 in Tregs.
