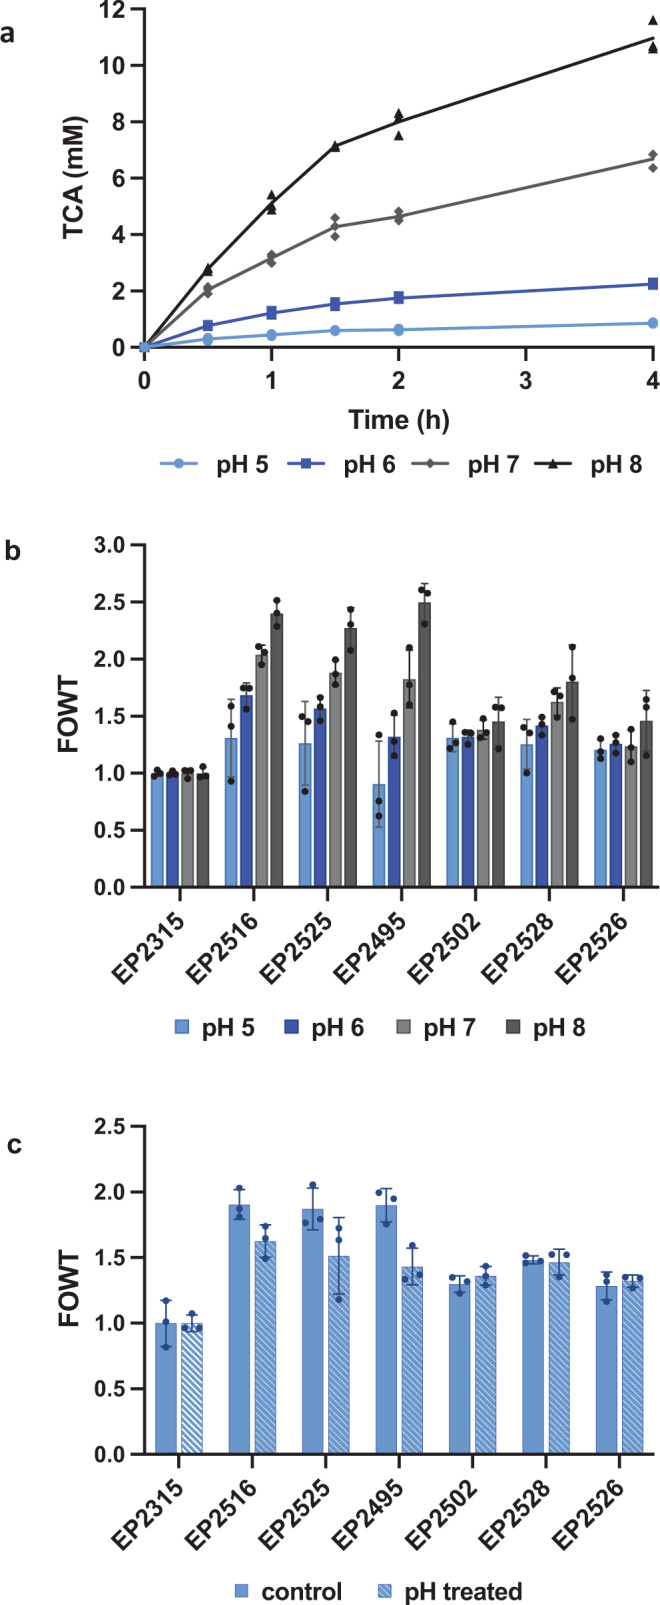
Fig. 4. Activity at different pH or after exposure to low pH.

a Whole-cell TCA production for EcN with wild-type StlA after 0.5 h, 1 h, 1.5 h, 2 h, or 4 h at pH 5, 6, 7, or 8. n = 3 biological replicates with individual data points shown. b Whole-cell PAL activity after 4 h at pH 5, 6, 7, or 8, normalized to wild-type StlA activity (fold over wild-type, FOWT). n = 3 biological replicates ± s.d. c Whole-cell PAL activity after 4 h at pH 7, assayed without pH treatment (control) or after incubation for 1 h at pH 5 (pH treated), normalized to wild-type StlA activity (FOWT). n = 3 biological replicates ± s.d. X axis labels refer to strain IDs, EcN with PAL variants. EP2315: wild-type StlA, EP2516: S92G_H133F_A433S_V470A, EP2525: S92G_H133M_I167K_L432I_V470A, EP2495: A93C_H133F_T322W_Y437N, EP2502: I28R_S92G_H133F_V470A, EP2528: S92G_H133F_R185E, EP2526: S92G_F109A_H133M_T503E. For additional time points and non-normalized TCA production data, refer to Supplementary Figure 4 and 5.
