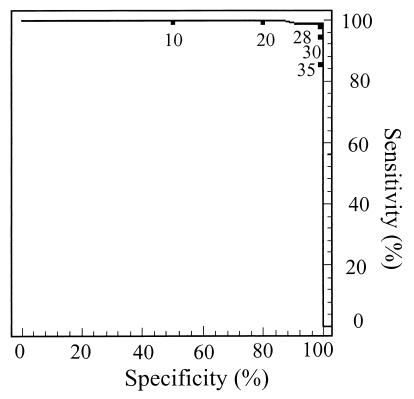
FIG. 1.
ROC analysis plotting percent sensitivity (y axis) against percent specificity (x axis) for various cutoff values of the CELISA for the detection of antibody to Brucella spp. A value of 28%I yielded the maximum sum of percent sensitivity and percent specificity and was considered to be the optimum cutoff value.

