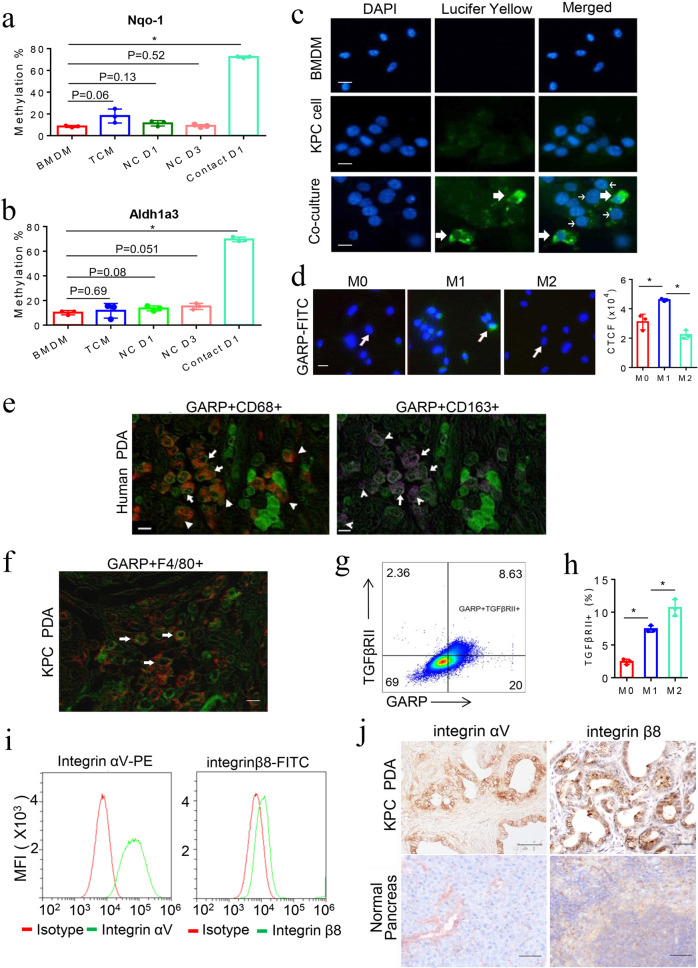
Fig. 2.
DNA methylation of the metabolism genes in macrophages is induced by direct interaction with PDA cells through GARP/TGF-βRII-integrin αV/β8. a, b Nqo-1 and Aldh1a3 methylation in mouse BMDMs in a transwell system separated from KPC cells by an 8-μm or 1-μm pore membrane that, respectively, allows or not allows tumor cells to migrate through and direct contract with macrophages and in BMDMs cultured with TCM. Nqo-1 and Aldh1a3 methylation quantified as described in Supplementary Methods. *P < 0.05 (Mann–Whitney U test). c Lucifer Yellow labeled-KPC cells were co-cultured with unlabeled BMDMs. Thick arrows indicate macrophages that contain Lucifer Yellow spread from KPC cells (thin arrow) around them. Scale bar: 20 μm. d GARP expression on M0, M1-like, and M2-like macrophages measured by immunofluorescent staining with FITC-conjugated anti-GARP antibody. Arrow indicates macrophages that have the highest fluorescence within each image. Scale bar: 20 μm. *P < 0.05 (ANOVA). Histogram (right panel) shows quantification of fluorescence intensity. e Multiplex immunohistochemistry (IHC) was performed on a single slide of human PDA tissues for GARP (in green), CD68 (in red) and CD163 (in purple). A representative among 20 human PDAs tested is shown. Arrows (both panels) indicate GARP-expressing CD68+CD163+ (M2-like) macrophages; and arrowheads (left panel) indicate GARP-expressing CD68+CD163- (M1-like) macrophages. Notched arrowheads (right panel) indicate CD68+CD163+ (M2-like) macrophages with little GARP expression. Scale bar: 50 μm. f Multiplex IHC staining of GARP (in green) on F4/80+ (in red) macrophages in PDAs from KPC mice. Scale bar: 50 μm. g TGF-βRII and GARP on cell surface of M0, M1-like, and M2-like macrophages co-stained and analyzed by flow cytometry. h Quantification of the percentages of TGF-βRII on cell surface of M0, M1-like, and M2-like macrophages by flow cytometry. *P < 0.05 (ANOVA). i Integrin subunits ɑV and β8 cell-surface expression was measured by flow cytometry. j IHC staining of PDA and normal pancreas tissues from KPC mice with anti-integrin ɑV and β8 antibodies. Scale bar: 100 μm. Data were from technical triplicates and representative of two experiments

