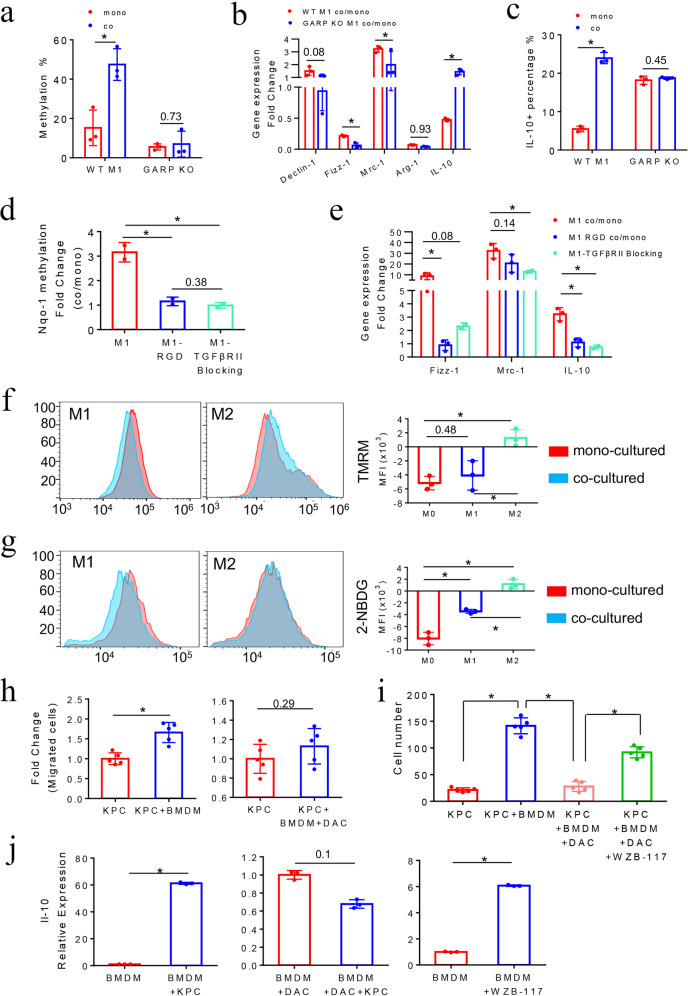
Fig. 4.
GARP mediates Nqo-1 methylation and M2-like phenotypical changes in M1-like macrophages after co-culturing with PDA cells. a Nqo-1 methylation in mouse WT M1-like macrophages compared to GARP KO M1-like macrophages. *P < 0.05 (paired t test). b RT-PCR of M2 marker genes in WT vs. GARP KO M1-like macrophages after co-cultured with KPC cells. Fold changes of these marker genes in co-cultured vs. monocultured M1-like macrophages were shown. Fold change >1: upregulation; fold change <1: downregulation. All results were first normalized by respective β-actin and then respective monocultured BMDMs. *P < 0.05 (Mann–Whitney U test). c Expression of the M2 cytokine IL-10 in WT vs. GARP KO M1-like macrophages after co-culturing with KPC cells, measured by flow cytometry analysis of percentages of IL-10-positive cells with intracellular staining of IL-10. *P < 0.05 (Mann–Whitney U test). d Fold changes of MSP results of the Nqo-1 gene in co-cultured vs. monocultured M1-like macrophages treated with RGD or TGF-βRII blocking antibody. *P < 0.05 (ANOVA). e Fold changes of RT-PCR results of M2 marker genes in co-cultured vs. monocultured M1-like macrophages treated with RGD or TGF-βRII blocking antibody. Data were first normalized by respective β-actin and then respective monocultured M0 macrophages. *P < 0.05 (ANOVA). f Mitochondrial membrane potentials in mouse M0, M1-like and M2-like macrophages after co-culturing with KPC cells by measuring mean fluorescence intensity of TMRM signals on the PE channel of flow cytometry, comparing mono- vs. co-cultured macrophages. *P < 0.05 (ANOVA). g Glucose uptake activities in M0, M1-like, and M2-like macrophages by measuring mean fluorescence intensity of 2-NBDG signals, comparing mono- vs. co-cultured macrophages. *P < 0.05 (ANOVA). h KPC cells were co-cultured with mouse BMDMs or DAC pretreated BMDMs in upper chamber of a transwell system with 8-μm pore membrane that allows them migrating to the lower chamber. Migrated KPC cells were examined by immunofluorescent staining with FITC-conjugated anti-Pan-CK antibody and counted. Fold changes of migrated KPC cell number in co-cultured vs. monocultured group (normalized as 1) were shown. *P < 0.05 (Mann–Whitney U test). i KPC cells were co-cultured with BMDMs pretreated with DAC, glucose uptake inhibitor WZB-117, or DAC + WZB-117, respectively, in the transwell system. Numbers of migrated KPC cells were counted as described in (h) and shown. *P < 0.05 (ANOVA). j Il-10 expression per RT-PCR in untreated, DAC, or WZB-117 pretreated BMDMs before (normalized as 1) and after co-culturing with KPC cells. *P < 0.05 (Mann–Whitney U test). Data are means ± SEM from technical duplicates and representative of two experiments

