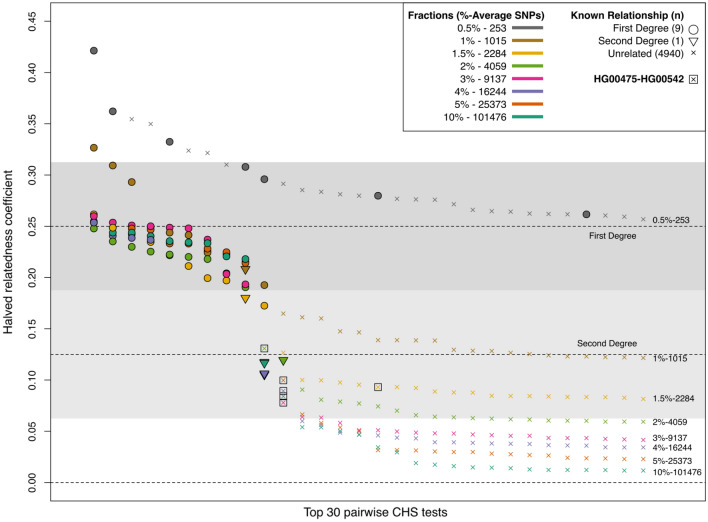
Figure 1.
Top 30 results ordered by HRC of all 4950 pairwise tests for the 100 individuals from the CHS population, for the eight subsampling fractions between 0.5 and 10%. Results are independently ordered for each fraction, so x-axis order is not expected to match. Known relationships are shown as filled symbols, and each different fraction as a specific colour. All triangles (second degree) are expected to fall within the lighter gray area, and all circles (first degree) within the darker gray area. The allele frequencies from the CHS population were used.

