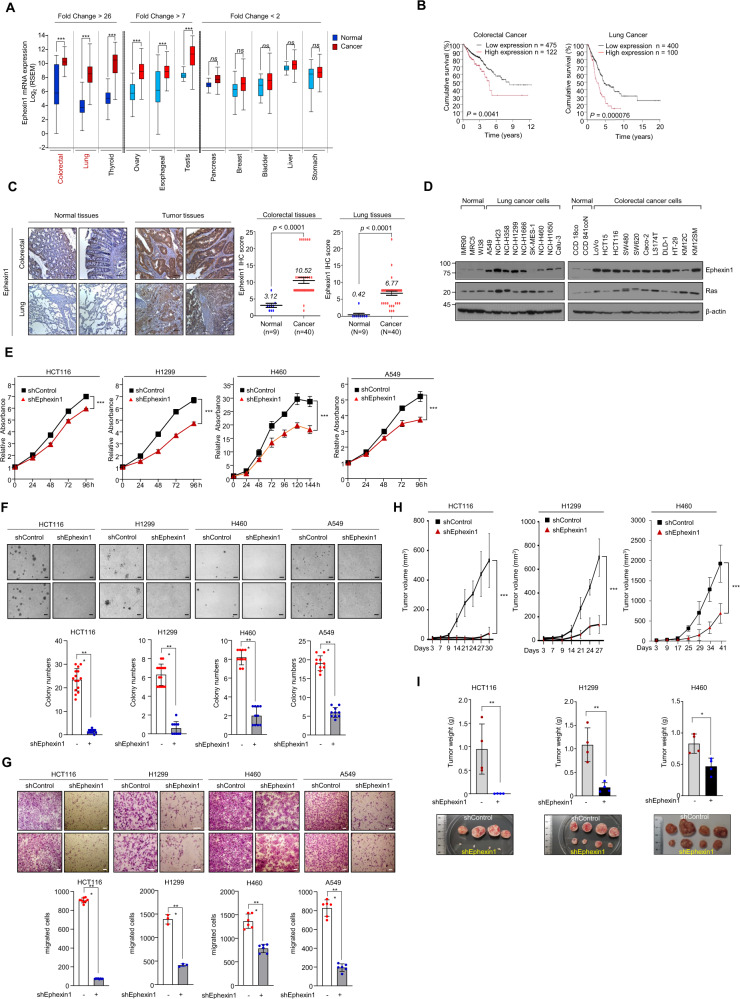
Fig. 1. Ephexin1 is upregulated in CRC and LC and promotes tumor cell growth and proliferation.
A Expression of Ephexin1 mRNA in 12 primary cancer types from TCGA. Data are shown as mean ± SD. ns not significant, ***P < 0.001, two-tailed Student’s t test. B Kaplan–Meier analysis of overall survival according to Ephexin1 in CRC and LC patients. P values are for a log-rank test. C Immunohistochemistry (IHC) staining was performed to evaluate Ephexin1 expression in CRC and LC tissues and their corresponding normal tissues. Hematoxylin is the counterstain. Scale bar = 100 μm. Data are shown as mean ± SD, P values are for a two-way ANOVA. D Ephexin1 protein expression in normal and indicated colon (n = 8) and lung (n = 11) cancer cell lines were examined by western blot. E Effect of Ephexin1 knockdown on cell proliferation by MTT assay in HCT116, H1299, H460, and A549 cells. Data are shown as mean ± SD. ***P < 0.001, two-way ANOVA. F, G Anchorage-independent growth assessed by soft agar assay (F) and migration ability (G) determined by transwell assay in Ephexin1-depleted HCT116, H1299, H460, and A549 cells. Representative images are shown. Scale bar = 100 μm. Data are shown as mean ± SD. **P < 0.01, and ***P < 0.001, two-tailed Student’s t test. H Control and Ephexin1-depleted HCT116, H1299, and H460 cells were inoculated subcutaneously in BALB/C nude mice (n = 4). Tumor volumes recoded at the indicated times are shown. Data are shown as mean ± SD. ***P < 0.001, two-way ANOVA. I Average tumor weight of each group at the endpoint of the experiment are shown. Data are shown as mean ± SD. *P < 0.05 and **P < 0.01, two-tailed Student’s t test.

