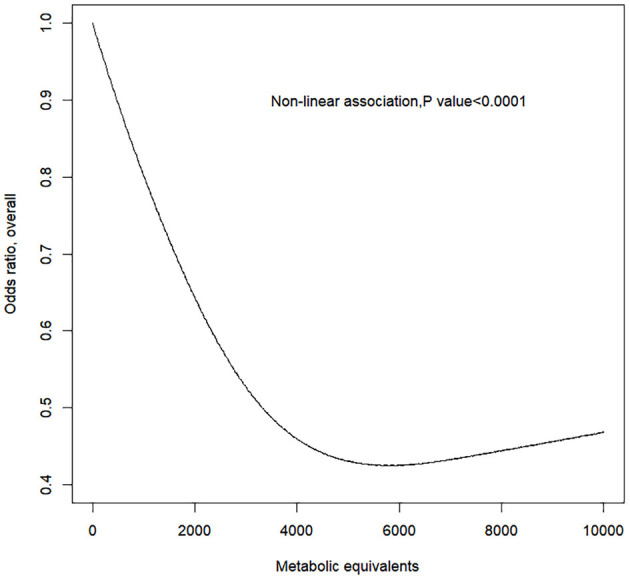
Figure 1.

Response between physical activity and the prevalence of peripheral artery disease for all subjects. Adjusted cubic spline models showing association between physical activity and the prevalence of peripheral artery disease in all participants. Models are adjusted for age, gender, race, education level, marital status, family poverty-to-income ratio, smoking, alcohol, body mass index, total cholesterol, and fasting plasma glucose. Knots are the 25, 50, and 75th percentiles for metabolic equivalents.
