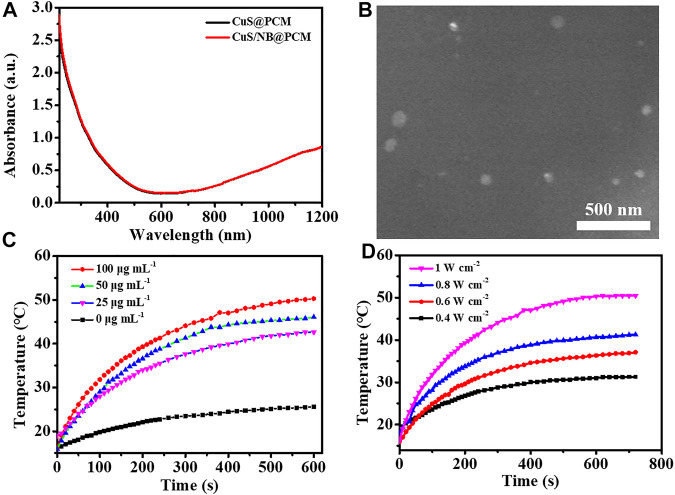
FIGURE 1.
(A) Absorption spectra of CuS@PCM NPs and NB/CuS@PCM NPs. (B) TEM image of NB/CuS@PCM NPs. (C) Elevated temperature profile of different concentrations of NB/CuS@PCM NPs under 1,064-nm laser (1 W cm−2) exposure. (D) The elevated temperature profile of NB/CuS@PCM NPs (100 μg ml−1) under different densities of 1,064-nm laser exposure.

