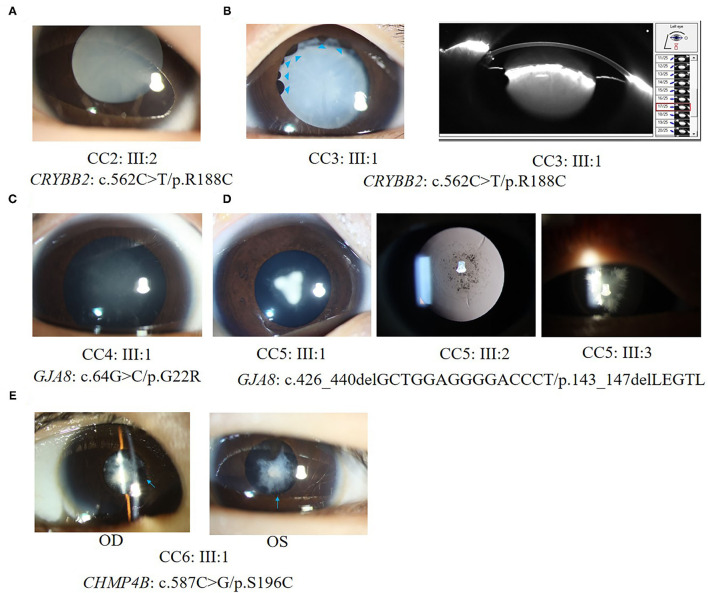
Figure 3.
Ocular phenotypes of patients with CCs. (A) The total cataract of III:2 in family CC2; (B) Left panel: the total cataract and primary iris cysts (blue arrowheads) of III:1 in family CC3; Right panel: the anterior segment image from Pentacam shows the 3 o'clock and 9 o'clock section of cataracts and iris cysts of III:1 in family CC3. (C) The fetal nuclear opacities with fuzzy Y-sutural opacity of III:1 in family CC4. (D) The Y-sutural and axial embryonal nuclear cataracts with different appearances of III:1, III:2, and III:3 in family CC5. (E) The anterior subcapsular cataracts and posterior synechia of iris (blue arrows) of III:1 in family CC6.

