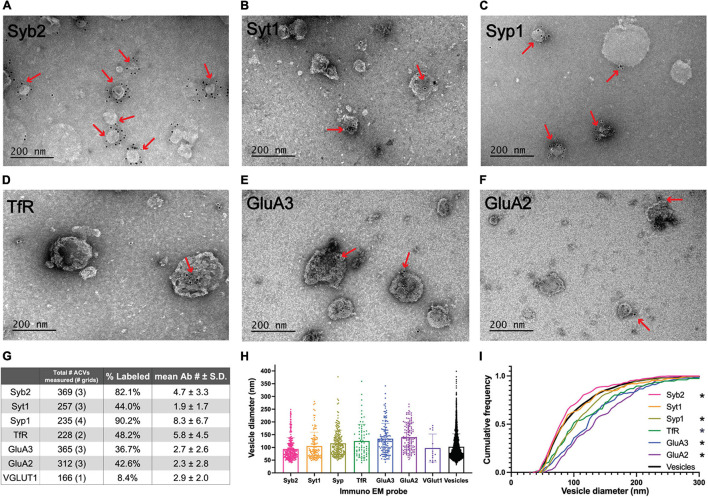
FIGURE 2.
Electron microscopy analysis of ACV samples. (A–F) Immuno-negative stain electron micrographs for GluA2, GluA3, Syb2, Syt1, TfR, and Syp1. Red arrows indicate regions with gold-conjugated secondary antibody. (G) Summary table of negative stain electron microscopy analysis of antibody labeled preparations of GluA1 peptide eluate of wild-type mice. Total number of ACVs represents all ACVs measured for the given probe. Each grid represents an independent preparation and imaging experiment (all images are provided as Source Data). (H) Mean and standard deviations of diameters of vesicles labeled with each antibody. (I) Normalized cumulative frequency distributions of diameters of vesicles labeled with each antibody. The bold line represents the frequency distribution of all vesicles from Figure 1D. The Kolmogorov–Smirnov test was performed to test statistical significance between an independent population of vesicles from Figure 1D and vesicles containing Syb2 (p = 0.0101), Syt1 (p = 0.9382), Syp1 (p < 0.0001), TfR (p = 0.0100), GluA2 (p < 0.0001), and GluA3 (p < 0.0001). *Indicates p-value < 0.05.

