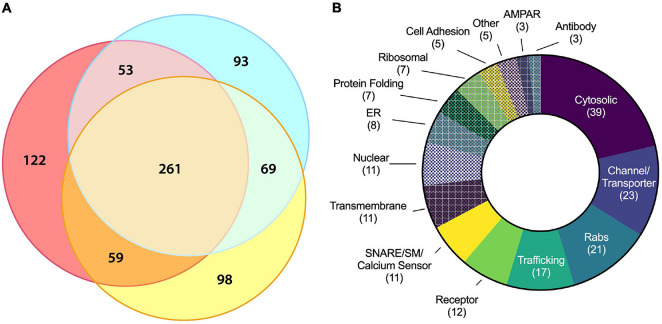
FIGURE 4.
Molecular characterization of ACV proteins using LC–MS/MS. (A) Three-way Venn diagram showing protein hits in three LC–MS/MS biological replicates with each color representing a biological replicate. (B) Protein ontology of the 180 identified candidates using gene ontology resource. See Table 1 for all data.

