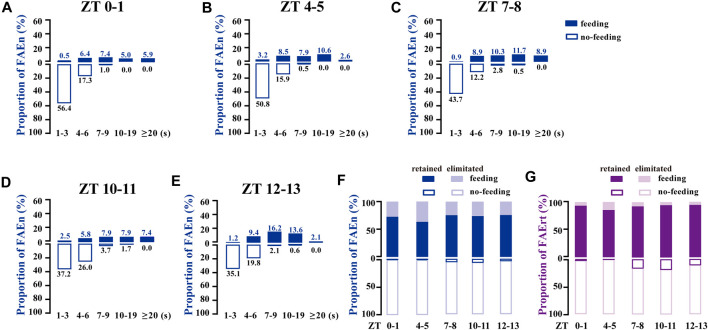
FIGURE 3.
FAE exhibits similar distributions of feeding and no-feeding behaviors at different time-points of the day (A–E) The proportion distribution of FAE at ZT0–1 (n = 202), ZT4–5 (n = 189), ZT7–8 (n = 213), ZT10–11 (n = 242), and ZT12–13 (n = 339) (F–G) With the cut-off threshold of 7 s, the proportion of retained and eliminated FAEn (F) and FAErt (G) at different times of the day. Data are shown for both sexes, with a total of 1,185 events and a total time of 8,603 s used for analysis.

