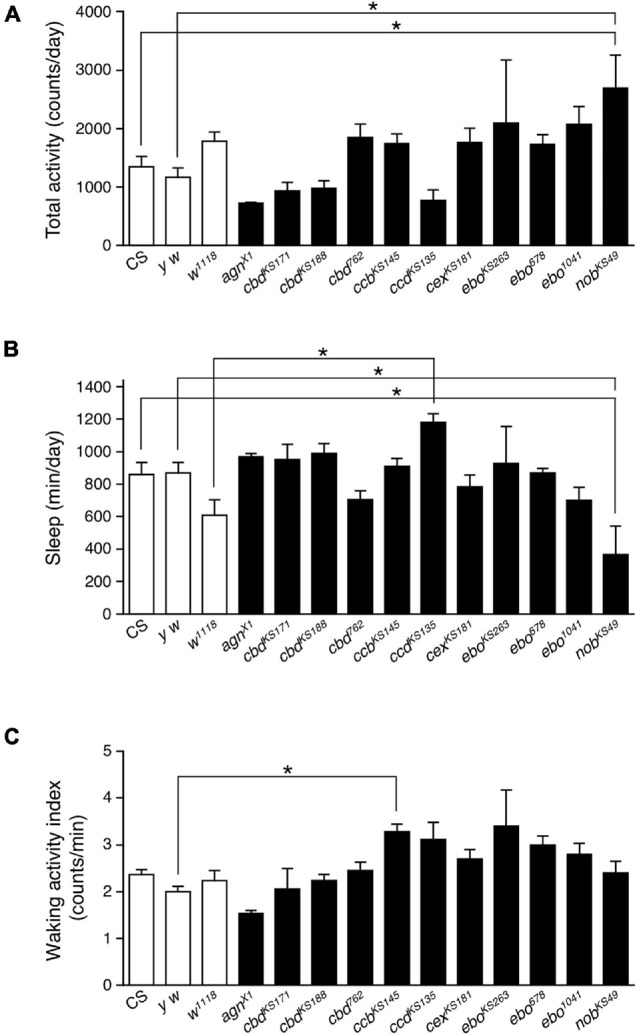
FIGURE 1.

The PB defective nobKS49 decreased sleep. Total daily activity (A), total sleep (B) and waking activity index (C) for control flies (Canton-S, y w and w1118, white bars) and mutant strains with structural defects in the central complex (black bars) in constant dark (DD) conditions. Data are averaged for 3 days and are presented as mean ± standard error of the mean (SEM) (n = 3–11 for each group). Groups with asterisks indicate statistically significant differences from controls (one-way ANOVA followed by Tukey-Kramer post hoc test, p < 0.05).
