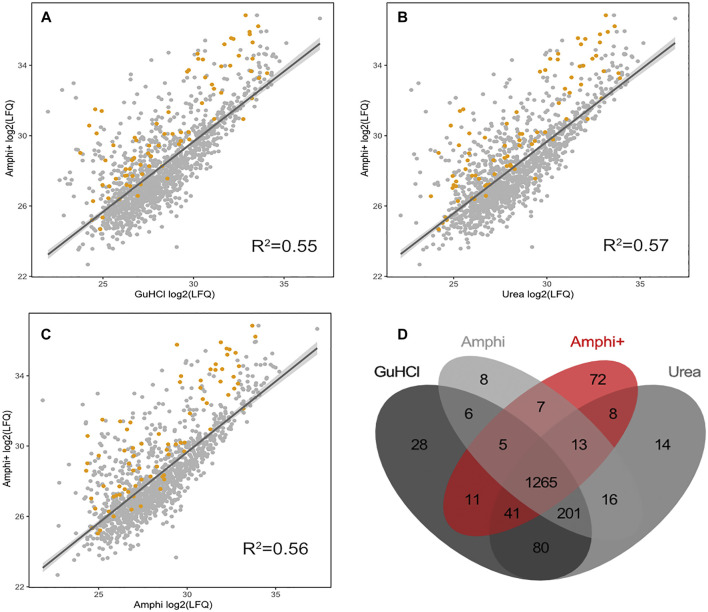
FIGURE 4.
Proteomics results of Amphi+ samples in comparison to other investigated extraction methods. (A–C) Correlation plots between log2 LFQ intensities of amphipol enriched samples (Amphi+) and 3 total protein extraction methods tested (amphi, urea and GuHCl). Identified annotated SEPs are highlighted in orange. (D) Venn diagram illustrating overlap in proteins quantified across all 3 total extraction methods (in grey scale) and compared to the Amphi + setup (red).

