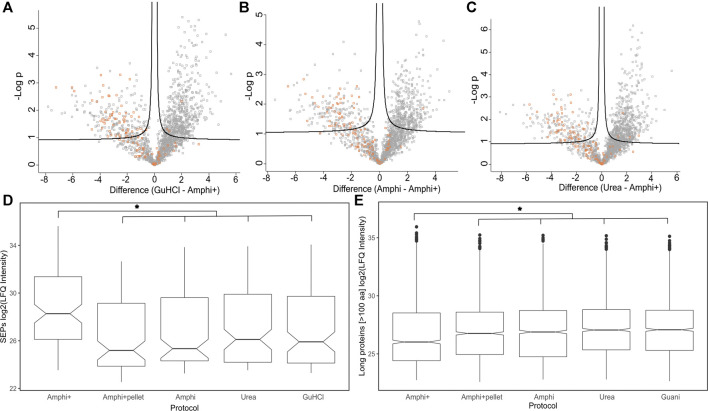
FIGURE 5.
Differential analysis of proteins enriched in Amphi+ setup. (A–C) Volcano plots illustrating differential protein abundances between investigated extraction protocols. The 3 total extraction methods (amphi, urea and GuHCl) are pair-wise compared to enriched amphipol samples (Amphi+) and the relation between log of p-value is plotted against fold change in protein abundance. Solid curved lines represent a significance threshold of 1% FDR (S0 = 0.1). SEPs are highlighted in orange. (D) Boxplot illustrating log2 LFQ intensities of SEPs identified in samples across all investigated experimental setups. Significant difference is marked with asterix (p-value <0.01, t-test) (E) Boxplot illustrating log2 LFQ intensities of proteins longer than 100 aa identified in all investigated experimental setups. Significant difference is marked with asterix (p-value <0.01, t-test).

