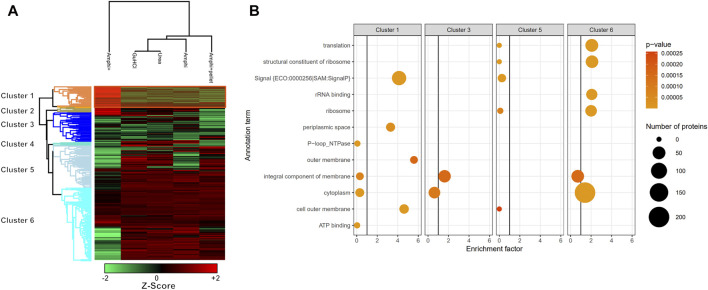
FIGURE 6.
Hierarchical clustering and GO enrichment analysis. (A) Hierarchical clustering of investigated experimental setups with the cluster of proteins significantly enriched in enriched Amphipol (Amphi+) samples (p-value <0.01) highlighted in orange (Cluster 1; Supplementary Table S2). Red represents higher abundance, green represents lower abundance. (B) GO analysis results presenting significantly regulated GO terms found in clusters corresponding to panel A. Size corresponds to the number of regulated proteins with a given GO term and color represents the p-value scale.

