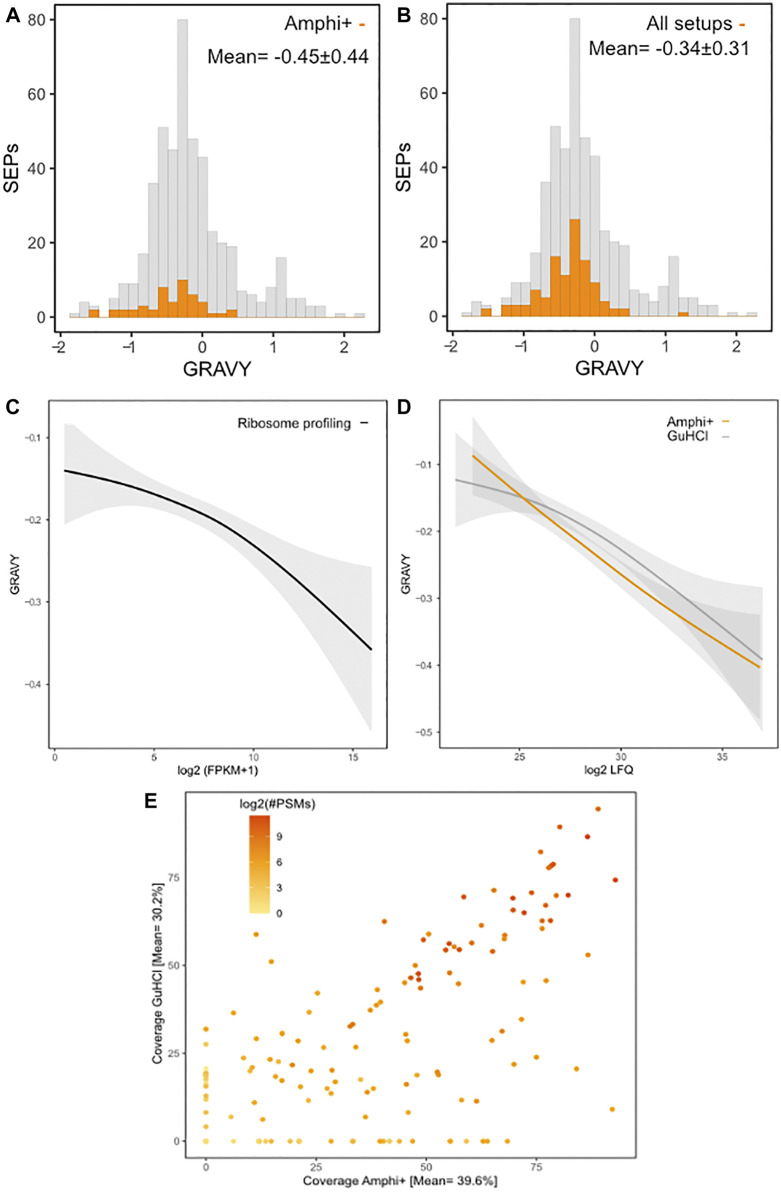
FIGURE 8.
Protein hydrophobicity and proteomic coverage across investigated protocols. (A) Histogram of GRAVY hydrophobicity scores of all annotated S. Typhimurium SEPs with SEPs with significant (p-value < 0.01) higher abundances in Amphi+ samples highlighted in orange. (B) Histogram of GRAVY hydrophobicity scores of all annotated S. Typhimurium SEPs with all SEPs identified in this study highlighted in orange. (C) Regression of the relation between protein hydrophobicity and expression as measured by ribosome profiling (log2 FPKMs). (D) Regression of the relation between protein hydrophobicity and expression as measured by proteomics (log2 iBAQ) in Amphi+ (orange) and GuHCl (grey) samples. Colored lines represent the median, greyed out areas represent middle 2 quartiles of data distribution. (E) Relation between coverage of SEPs observed in GuHCl vs. Amphi+ setup with a number of PSMs matches represented in log2 scale.

