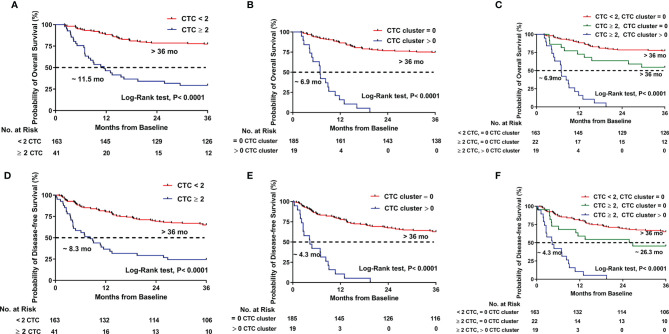
Figure 2.
Kaplan–Meier estimates of the probability of overall survival (OS) and disease-free survival (DFS) in HCC patients. (A) OS between CTC ≥ 2 and CTC < 2. (B) OS between CTC cluster > 0 and CTC cluster = 0. (C) OS compared across the three risk groups (CTC < 2, CTC cluster = 0; CTC ≥ 2, CTC cluster = 0; and CTC ≥ 2, CTC cluster > 0). (D) DFS between CTC ≥ 2 and CTC < 2. (E) DFS between CTC cluster > 0 and CTC cluster = 0. (F) DFS compared across the three risk groups (CTC < 2, CTC cluster = 0; CTC ≥ 2, CTC cluster = 0; and CTC ≥ 2, CTC cluster > 0).

