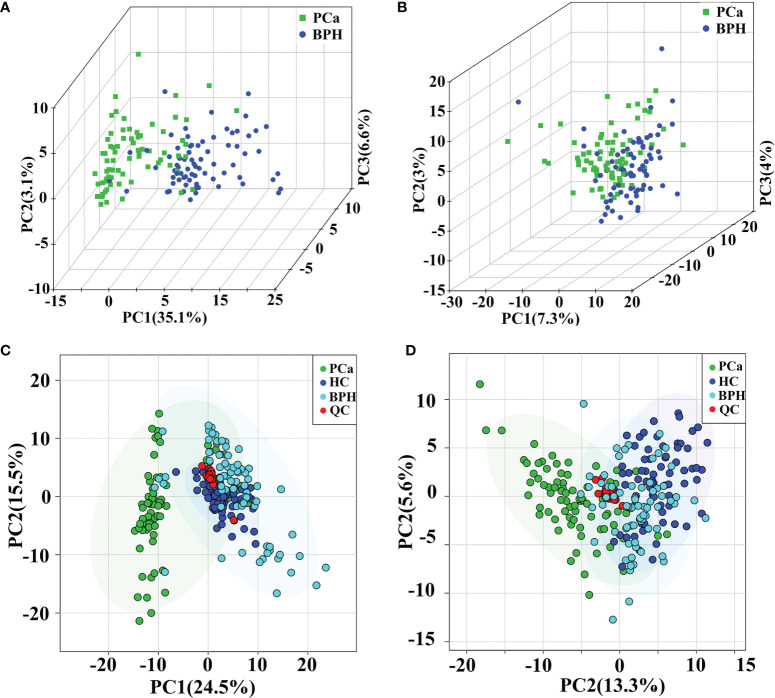
Figure 2.
PCA score plots in positive (A) and negative (B) ion modes between PCa and BPH groups. PCA score plots of QC samples in positive (C) and negative (D) ion modes among PCa, BPH, and HC groups. PCA, principal component analysis; PCa, prostate cancer; BPH, benign prostatic hyperplasia; QC, quality control; HC, healthy control.

