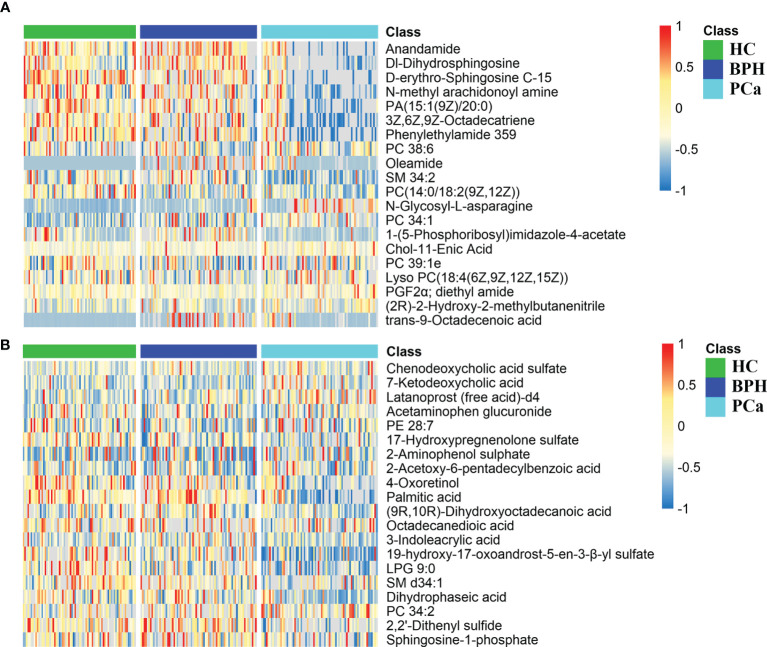
Figure 4.
Differential metabolite heat maps in positive (A) and negative (B) modes. The columns represent samples, the rows represent metabolites, and the relative content of the metabolites is displayed by color. The heat map shows differential metabolites among HC, BPH, and PCa groups. HC, healthy control; BPH, benign prostatic hyperplasia; PCa, prostate cancer.

