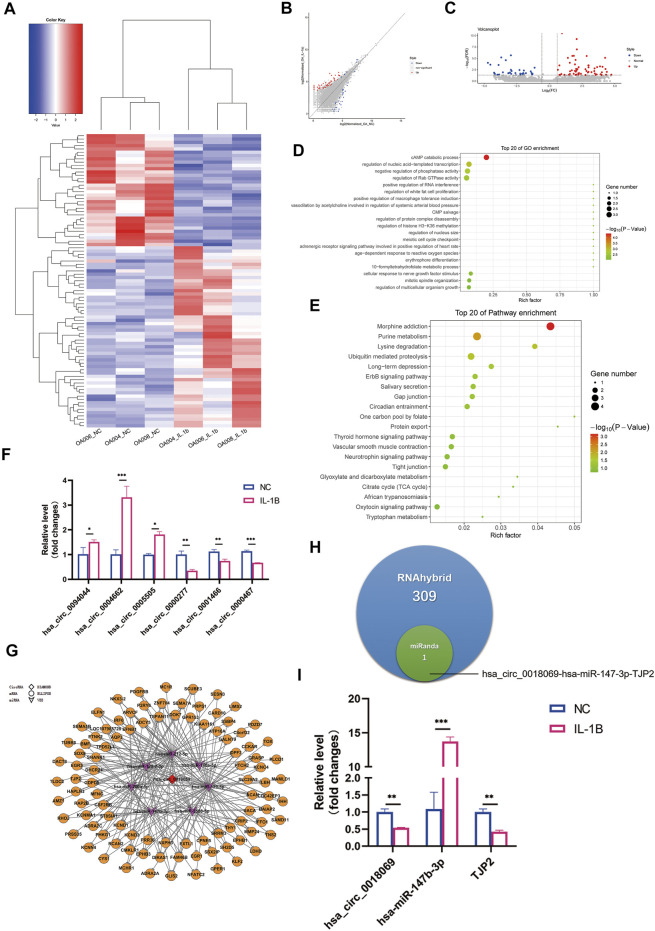
FIGURE 4.
Differential expression profile of circular RNA (circRNA) and potential ceRNA prediction. (A) Hierarchical clustering illustrates distinguished expression difference of circRNA between the two groups and homogeneity between groups. (B) Volcano plots of differentially expressed circRNAs. (C) Scatter plots of differentially expressed circRNAs. (D) The 20 most enriched Gene Ontology (GO) terms for the parental genes of differentially expressed circRNA in degenerative menisci treated with IL-1β. (E) The 20 most enriched pathway terms for the parental genes of differentially expressed mRNA in degenerative menisci treated with IL-1β. (F) Relative expression levels of selected circRNAs in negative control versus IL-1β-treated osteoarthritis (OA) menisci. GAPDH was used as the internal reference gene for qRT-PCR relative expression. Error bars reveal the standard deviation or the standard error of the data. The statistical methods are described above. *p < 0.05, **p < 0.01, ***p < 0.001. (G) Hsa_circ_0018069 ceRNA network consists of one circRNA, seven miRNAs, and 97 mRNAs (RNAhybrid_Energy < −25). The red diamond represents downregulated lncRNA LOC107986251. The purple arrows represent upregulated miRNAs. The orange circles represent suppressed mRNAs. (H) Venn diagram of the predicted hsa_circ_0018069 ceRNA networks by miRanda and RNAhybrid algorithms. (I) qRT-PCR validation of hsa_circ_0018069, hsa-miR-147-3p, and TJP2 ceRNA regulation patterns upon IL-1β stimulation in degenerative menisci. GAPDH was used as the internal reference gene for qRT-PCR relative expression. Error bars reveal the standard deviation or the standard error of the data. The statistical methods are described above. *p < 0.05, **p < 0.01, ***p < 0.001.

