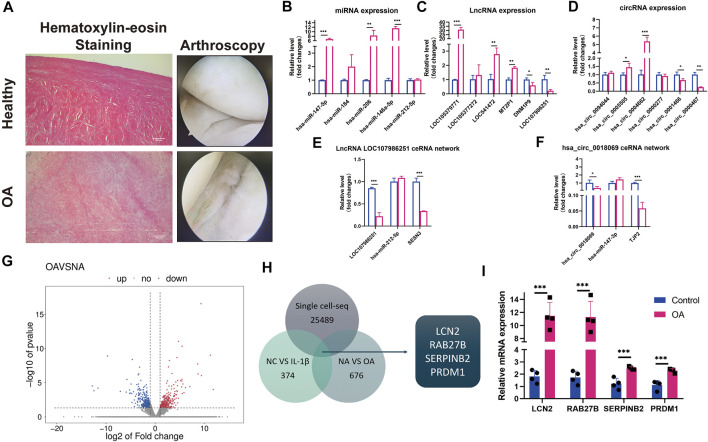
FIGURE 5.
qRT-PCR certification on control and degenerative meniscus and the selection of potential osteoarthritis (OA) biomarkers in meniscus. (A) Hematoxylin–eosin staining and arthroscopy of the meniscus from normal and degenerative OA meniscus. (B) Relative expression levels of selected differentially expressed microRNAs (DEMs) in normal versus degenerative meniscus. U6 was used as the internal reference gene for qRT-PCR relative expression. Error bars reveal the standard deviation or the standard error of the data. The statistical methods are described above. *p < 0.05, **p < 0.01, ***p < 0.001. (C) Relative expression levels of selected differentially expressed circRNA (DECs) in normal versus degenerative meniscus. GAPDH was used as the internal reference gene for qRT-PCR relative expression. Error bars reveal the standard deviation or the standard error of the data. The statistical methods are described above. *p < 0.05, **p < 0.01, ***p < 0.001. (D) Relative expression levels of selected differentially expressed lncRNAs (DELs) in normal versus degenerative meniscus. GAPDH was used as the internal reference gene for qRT-PCR relative expression. Error bars reveal the standard deviation or the standard error of the data. The statistical methods are described above. *p < 0.05, **p < 0.01, ***p < 0.001. (E) Relative expression patterns of lncRNA LOC107986251hsa_circ_0018069 in normal versus degenerative meniscus. GAPDH was used as the internal reference gene for qRT-PCR relative expression. Error bars reveal the standard deviation or the standard error of the data. The statistical methods are described above. *p < 0.05, **p < 0.01, ***p < 0.001. (F) Relative expression patterns of hsa_circ_0018069 in normal versus degenerative meniscus. GAPDH was used as the internal reference gene for qRT-PCR relative expression. Error bars reveal the standard deviation or the standard error of the data. The statistical methods are described above. *p < 0.05, **p < 0.01, ***p < 0.001. (G) The scatter plots of differentially expressed mRNAs between normal and degenerative menisci. (H) The Venn diagram of single-cell sequence data of normal meniscus versus degenerative meniscus, whole-transcriptome sequence data of control versus IL-1βstimulated OA degenerative meniscus, and RNA sequence data of normal meniscus versus OA degenerative meniscus. (I) qRT-PCR confirmation of the screening mRNA (LCN2, RAB27B, PRDM1, and SERPINB2). GAPDH was used as the internal reference gene for qRT-PCR relative expression. Error bars reveal the standard deviation or the standard error of the data. The statistical methods are described above. *p < 0.05, **p < 0.01, ***p < 0.001.

