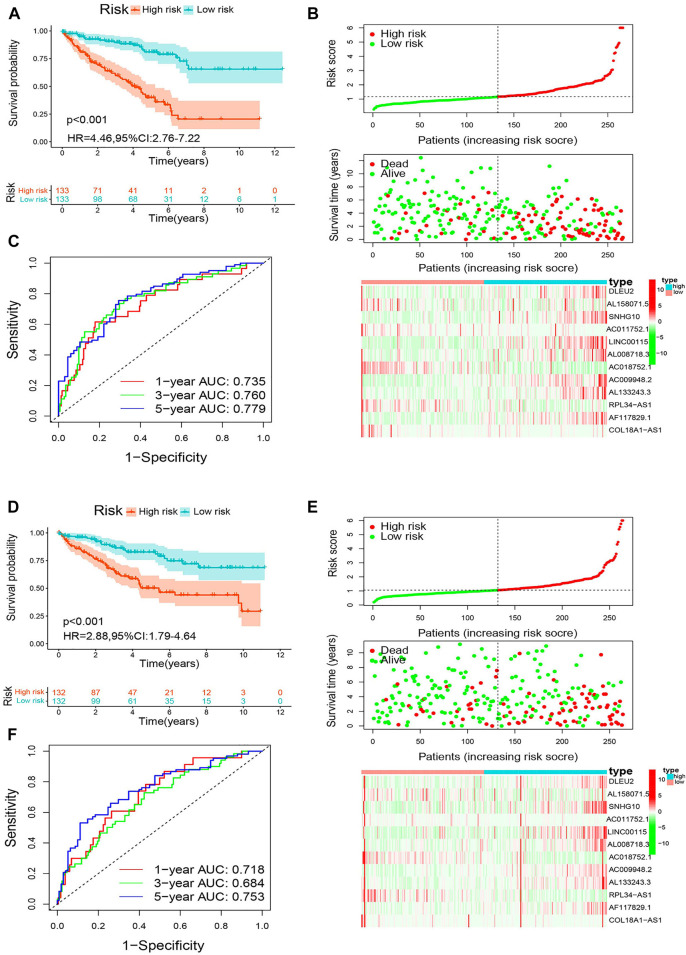
FIGURE 7.
Analysis of the m6A-RLPS efficacy in patients stratified by risk level. (A) Kaplan–Meier curves of overall survival (OS) for the m6A-RLPS (B) Distributions of risk scores, survival status, and relative lncRNA expression; and (C) ROC curves for predicting 1-, 3-, and 5-years OS rates in the training cohort. (D) Kaplan–Meier curves of OS for the m6A-RLPS (E) Distributions of risk scores, survival status, and relative lncRNA expression; and (F) ROC curves for predicting 1-, 3-, and 5-years OS rates in the first validation cohort.

