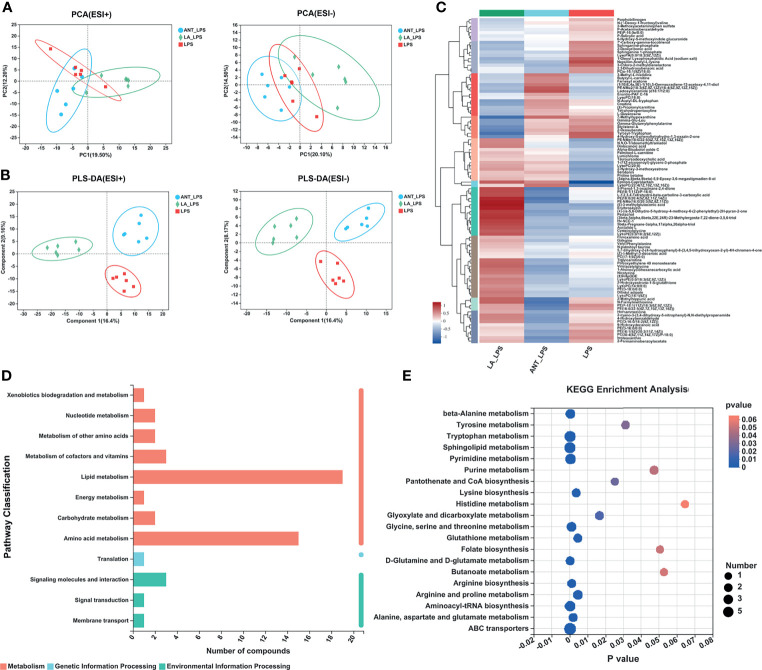
Figure 3.
Multivariate statistical analysis, hierarchical clustering and summary of Kyoto Encyclopedia of Genes and Genomes (KEGG) enrichment pathways. LPS: fed with a basal diet and injected with 0.5 mg/kg LPS; ANT+LPS: fed with a basal diet supplemented with 75 mg/kg ANT, and injected with 0.5 mg/kg LPS; LA+LPS: fed with a basal diet supplemented with 1000 mg/kg LA, and injected with 0.5 mg/kg LPS. N=6 in each group. (A) Principal component analysis (PCA) score plot of nontargeted metabolite profiling of the serum samples among the three groups in both positive (ESI+) and negative ionization modes (ESI-). (B) Partial least squares-discriminant analysis (PLS-DA) score plot of metabolite profiling among groups in ESI+ and ESI-. (C) Hierarchical clustering analysis of serum metabolites from the LPS, ANT+LPS and LA+LPS groups. (D) KEGG pathway classification. The compounds were enriched and numbered at the second KEGG level. (E) Bubble diagram showing the KEGG enrichment analysis. The bubble size indicates enriched the numbers, while the color shade indicates the differences.

